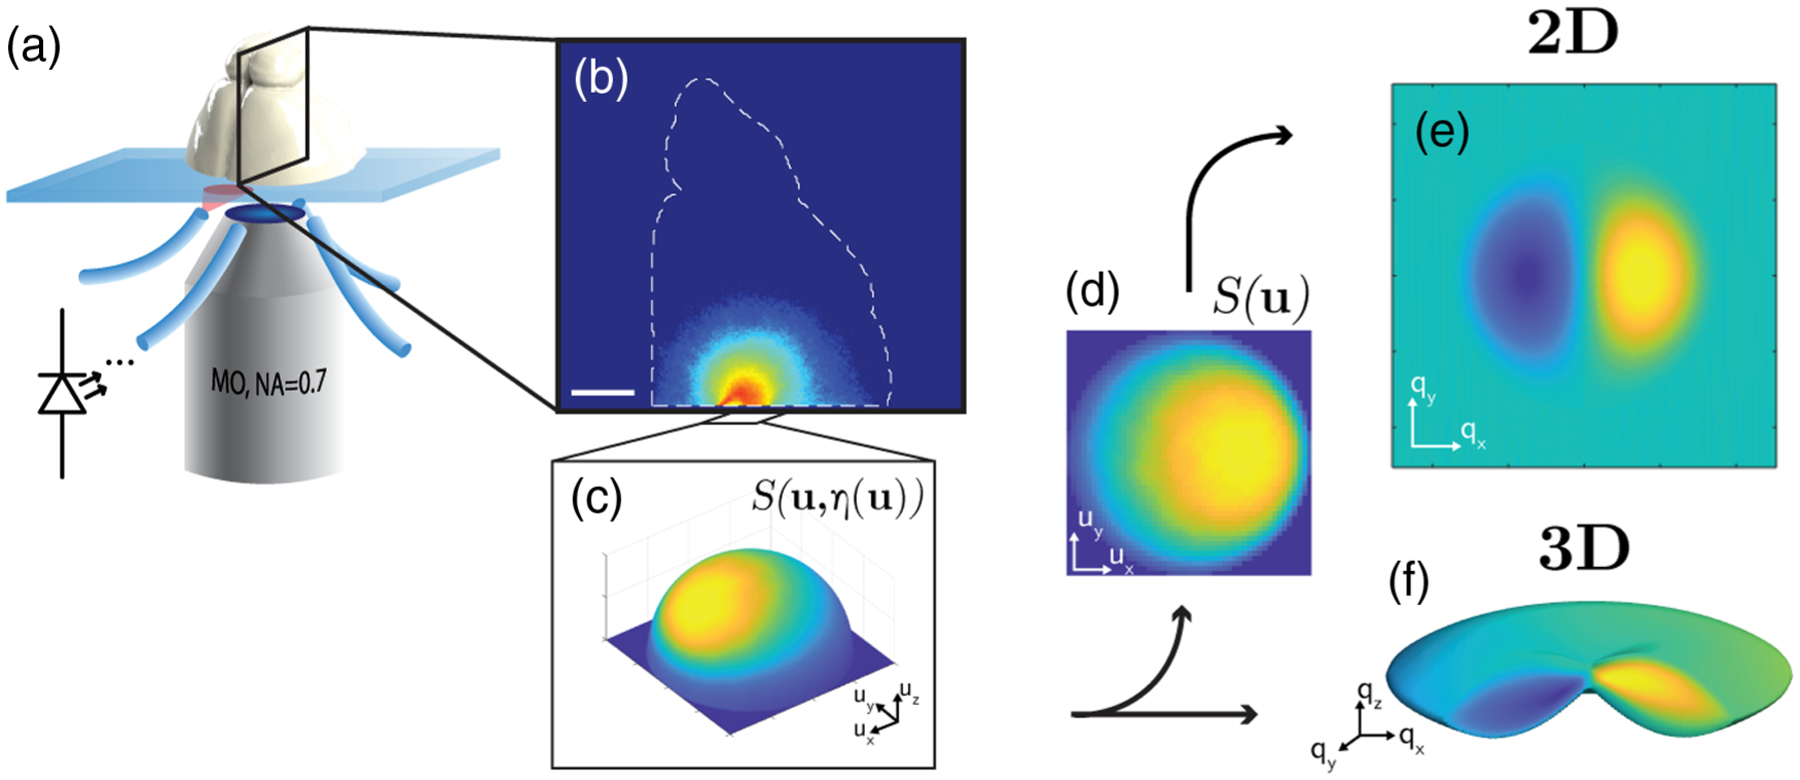
Fig. 1.

System diagram and processing overview. (a) LED-illuminated inverted microscope configuration with coronally sectioned rat brain on a slide. (b) Log visitation likelihood projection through transverse shear axis, demonstrating a high-fidelity Monte Carlo simulation geometry. Scale bar is 2.5 mm. (c) Photon angular distribution collected at the sample plane. This distribution is shown on the unit sphere surface to indicate that the non-paraxial angular coordinates represent a 3D unit vector in the direction [ux, uy, η], where . (d) Source distribution projected onto a planar coordinate grid u = [ux, uy], scaled with obliquity factor η. (e) Example 2D phase transfer function in pupil plane coordinates q = [qx, qy] corresponding to wavelength-scaled spatial frequency grid. (f) Example 3D phase transfer function distribution in the 3D pupil plane coordinates [qx, qy, qz].
