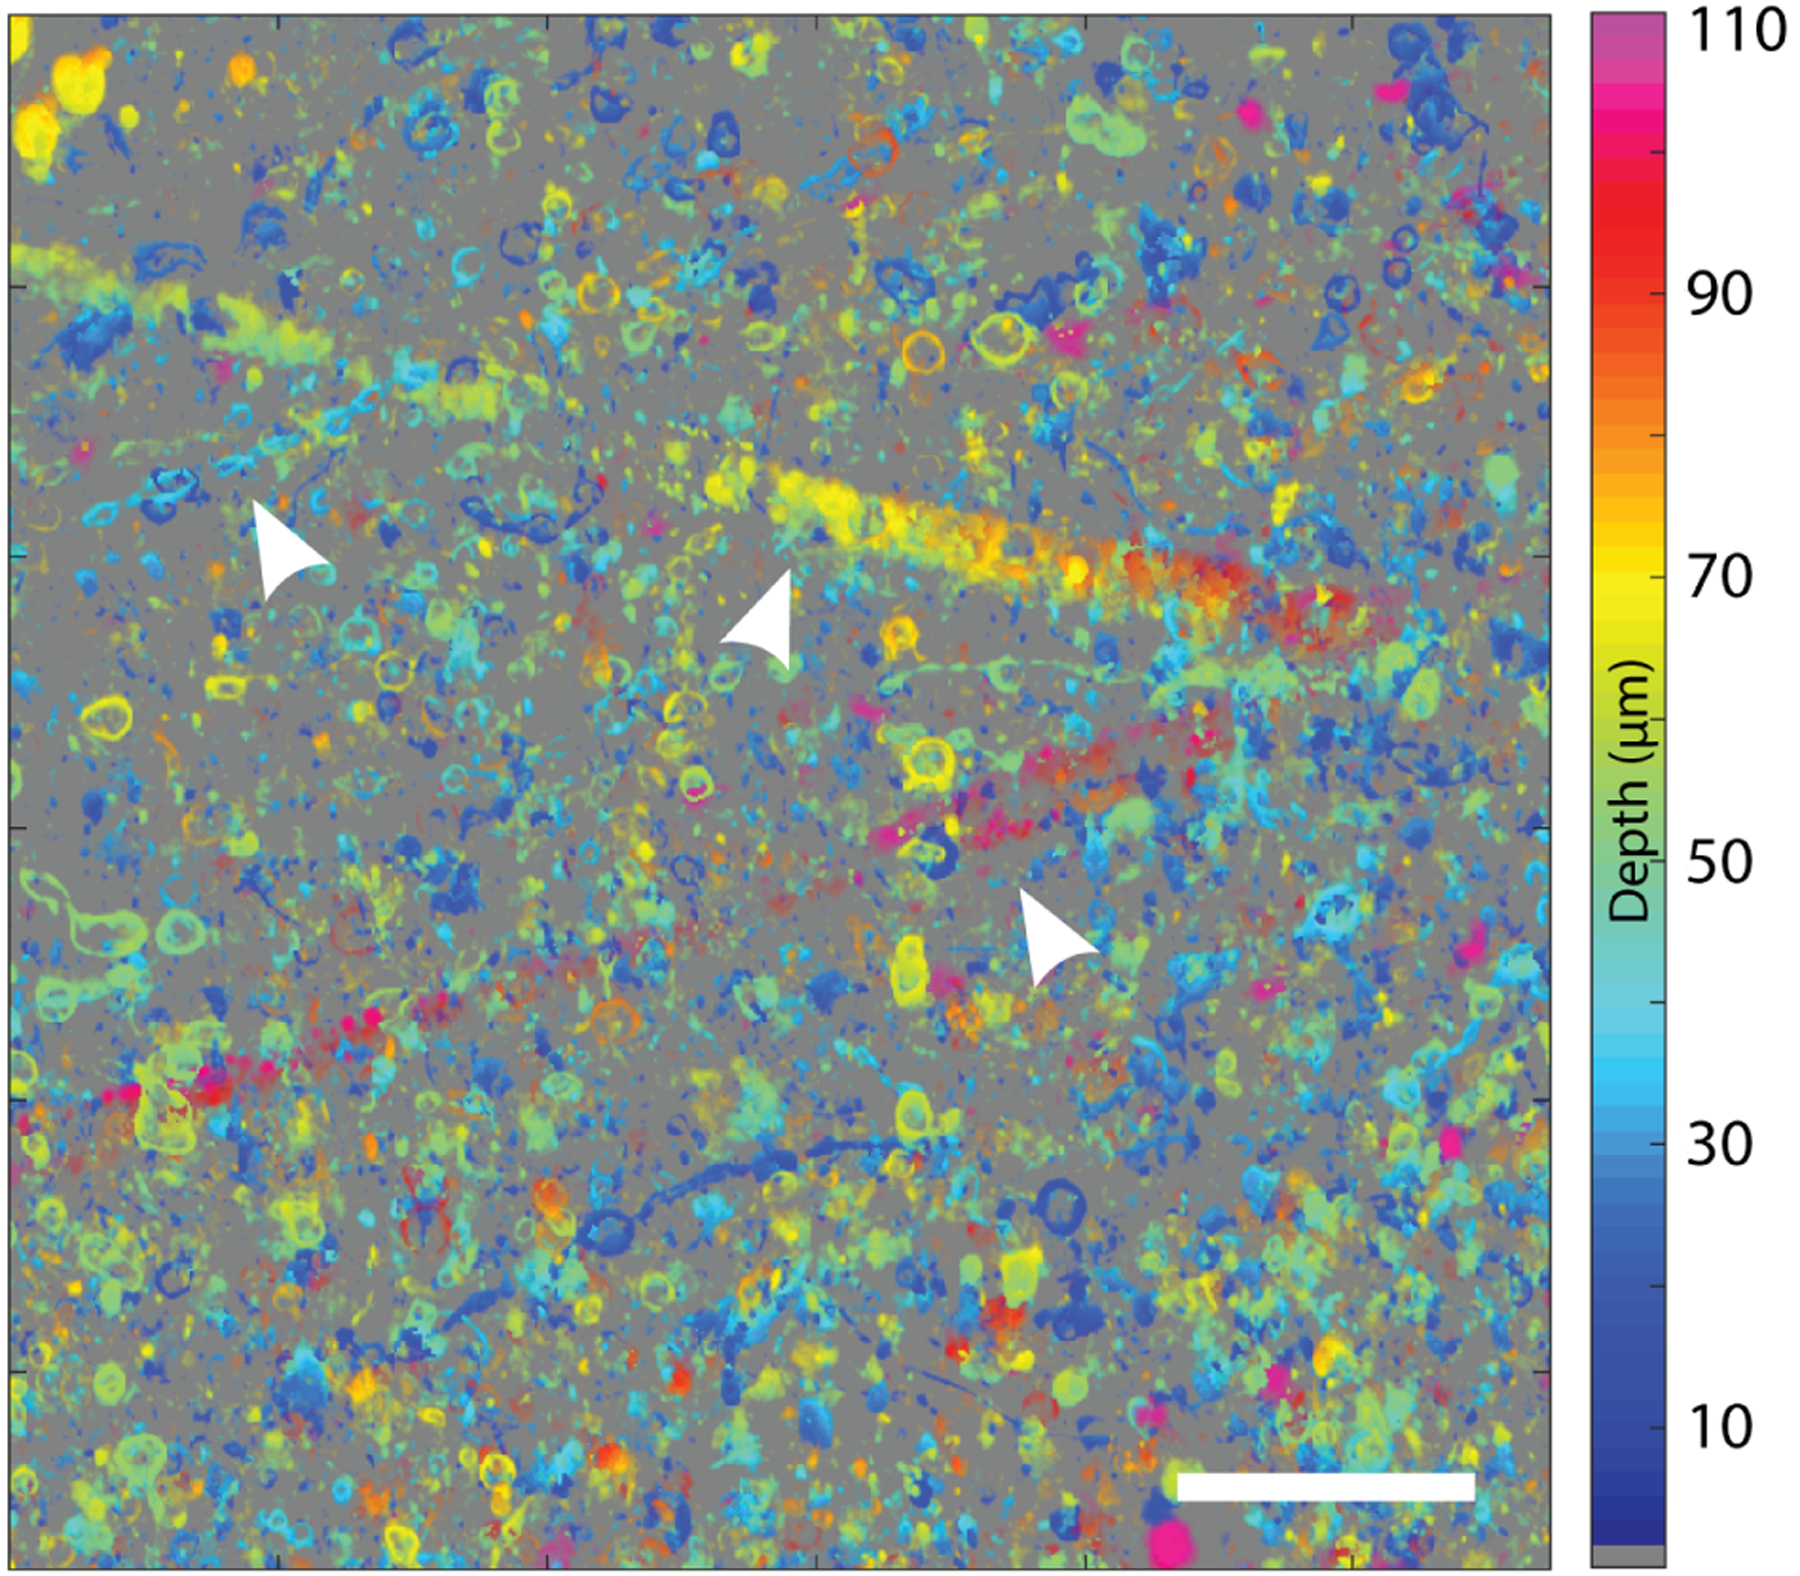
Fig. 4.

Depth coded maximum intensity projection in XY, depth encoded by color. The most prominent visible features are myelinated axons, due to their high-RI lipid rich content. From left to right, the arrows indicate an axon, a descending blood vessel, and an ascending blood vessel. Scale bar is 50 μm.
