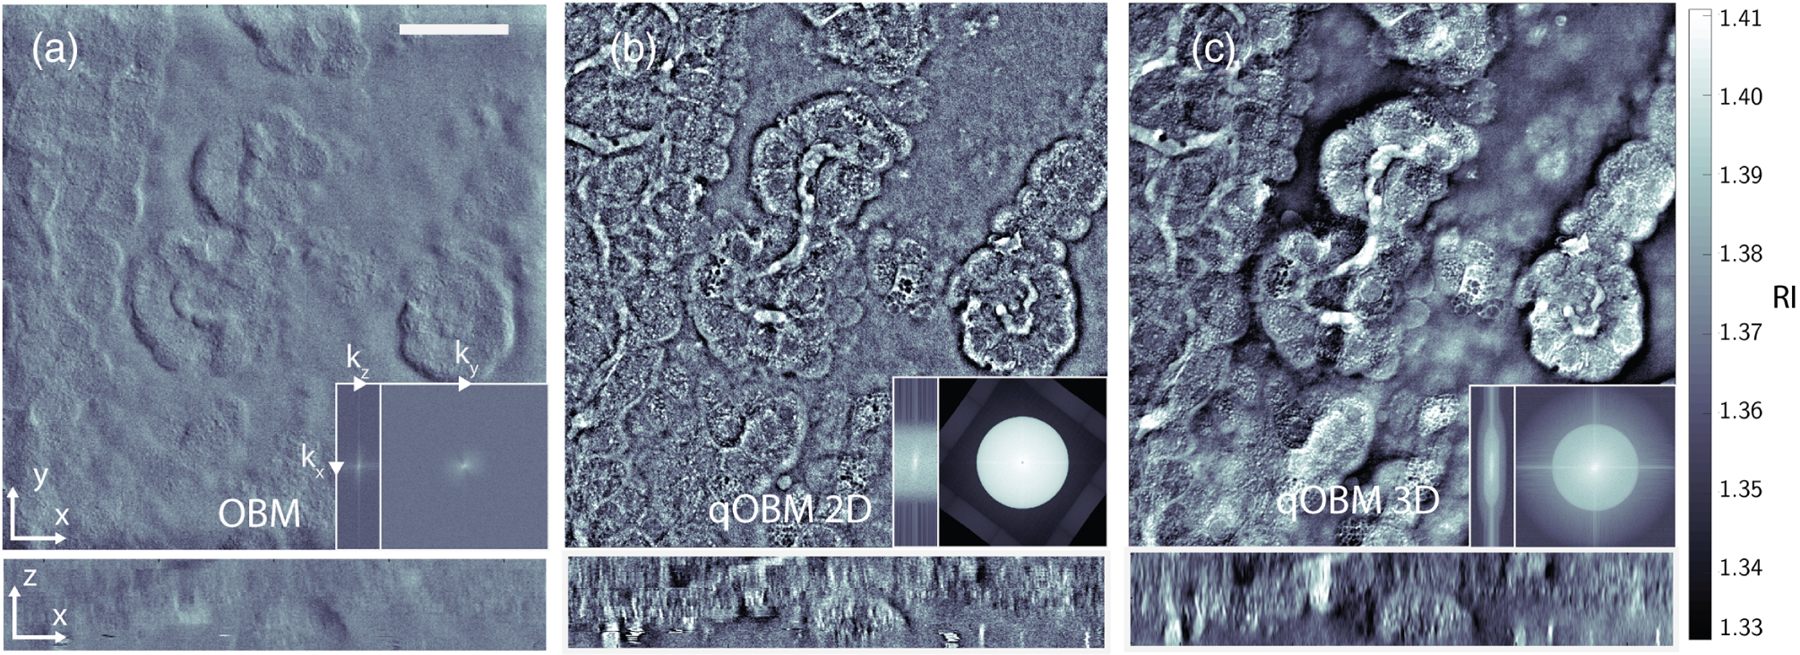
Fig. 5.

Rat brain choroid plexus. A 243 μm × 243 μm × 44 μm image volume is shown from a large intact rostral half of the brain. (a) En face (x − y) phase contrast image produced by original OBM, cross section at 15 μm depth. Bottom shows x − z cross section. Scale bar represents 50 μm. Left inset, axial (kx, kz) Fourier space of reconstructed volume. Right inset, transverse (kx, ky) Fourier space of reconstructed volume. Spatial frequency axes shown span ± 3.7 μm−1 laterally (kx, ky) and ± 1 μm−1 axially (kz). Note missing bow-tie region due to lack of transverse shear information. (b) Same regionas (a), 2D reconstruction from two orthogonal illuminations. Left and right insets, corresponding Fourier space cross sections in x − z and x − y spatial frequencies, respectively. Note cylindrical shape of reconstructed support structure, indicating a passage of high z-frequency noise. (c) Same region as (b), but with a 3D OTF reconstruction. Note the preservation of low- to mid-range frequencies indicating mesoscale structure of epithelial folds in choroid plexus. Left and right insets, corresponding Fourier space cross sections in x − z and x − y spatial frequencies, respectively. Note that the region of support is roughly limited to frequencies predicted by the 3D linear OTF.
