
FIGURE 10.
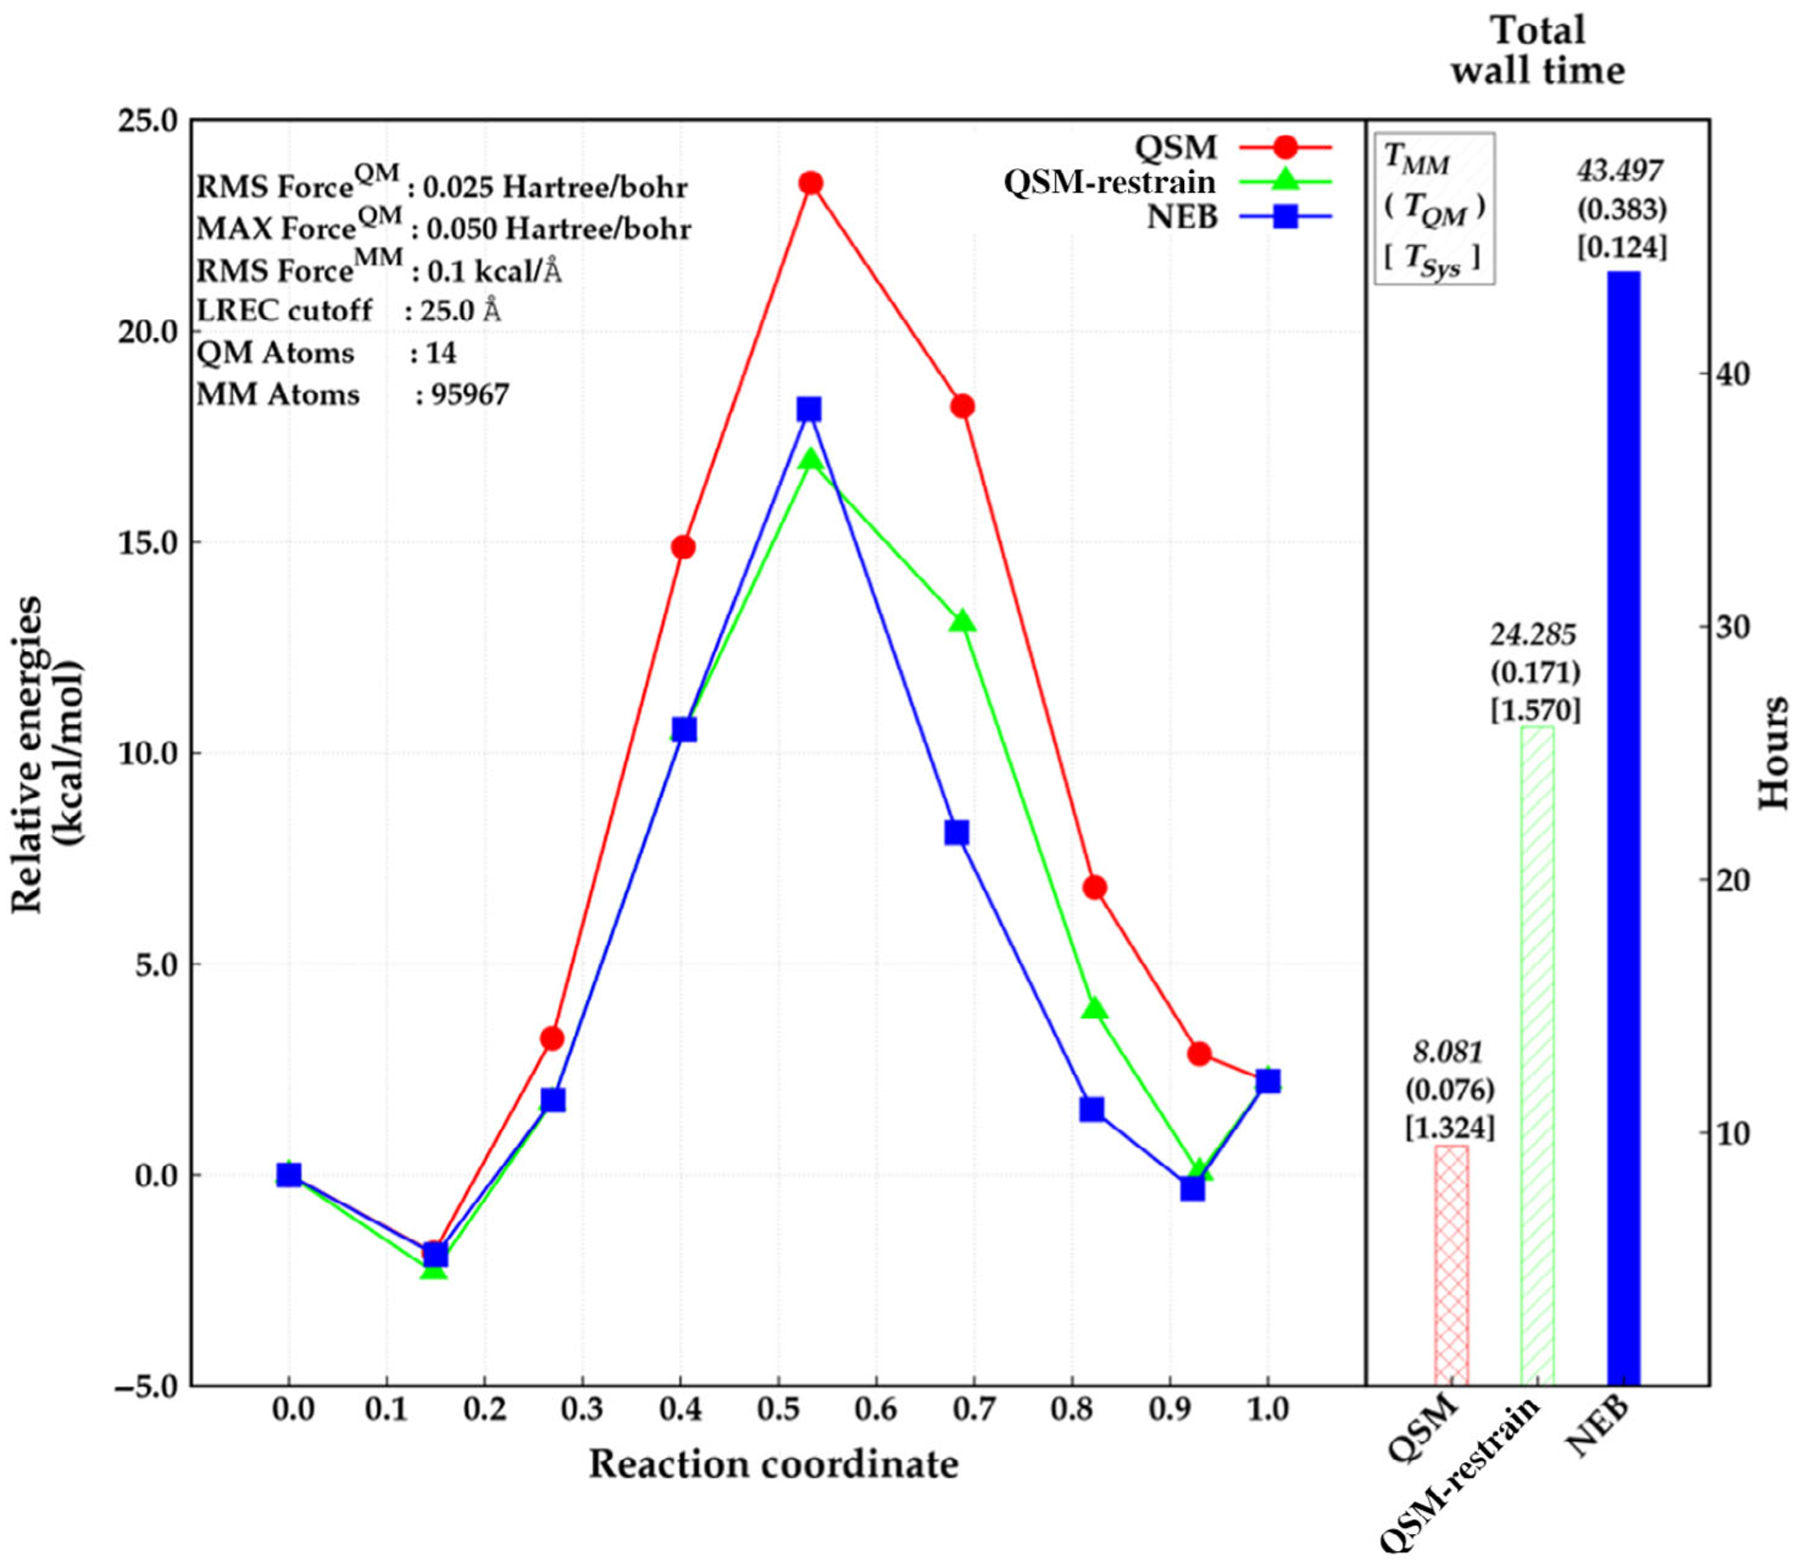
Relative energies obtained by NEB (blue, square) and QSM (red, circle), and QSM using the restrained-MM method (green, triangle) along the reaction coordinate (left), and total wall time required for the optimization in hours (right). The wall time for MM calculations, QM calculations, and for system calls are depicted above the wall time bars (right)
Source: Reprinted with permission from H. Gökcan, E. Antonio Vázquez-Montelongo, G. Andrés Cisneros, J. Chem. Theory Comput. 2019, 15 (5), 3056–3065. Copyright (2019) American Chemical Society