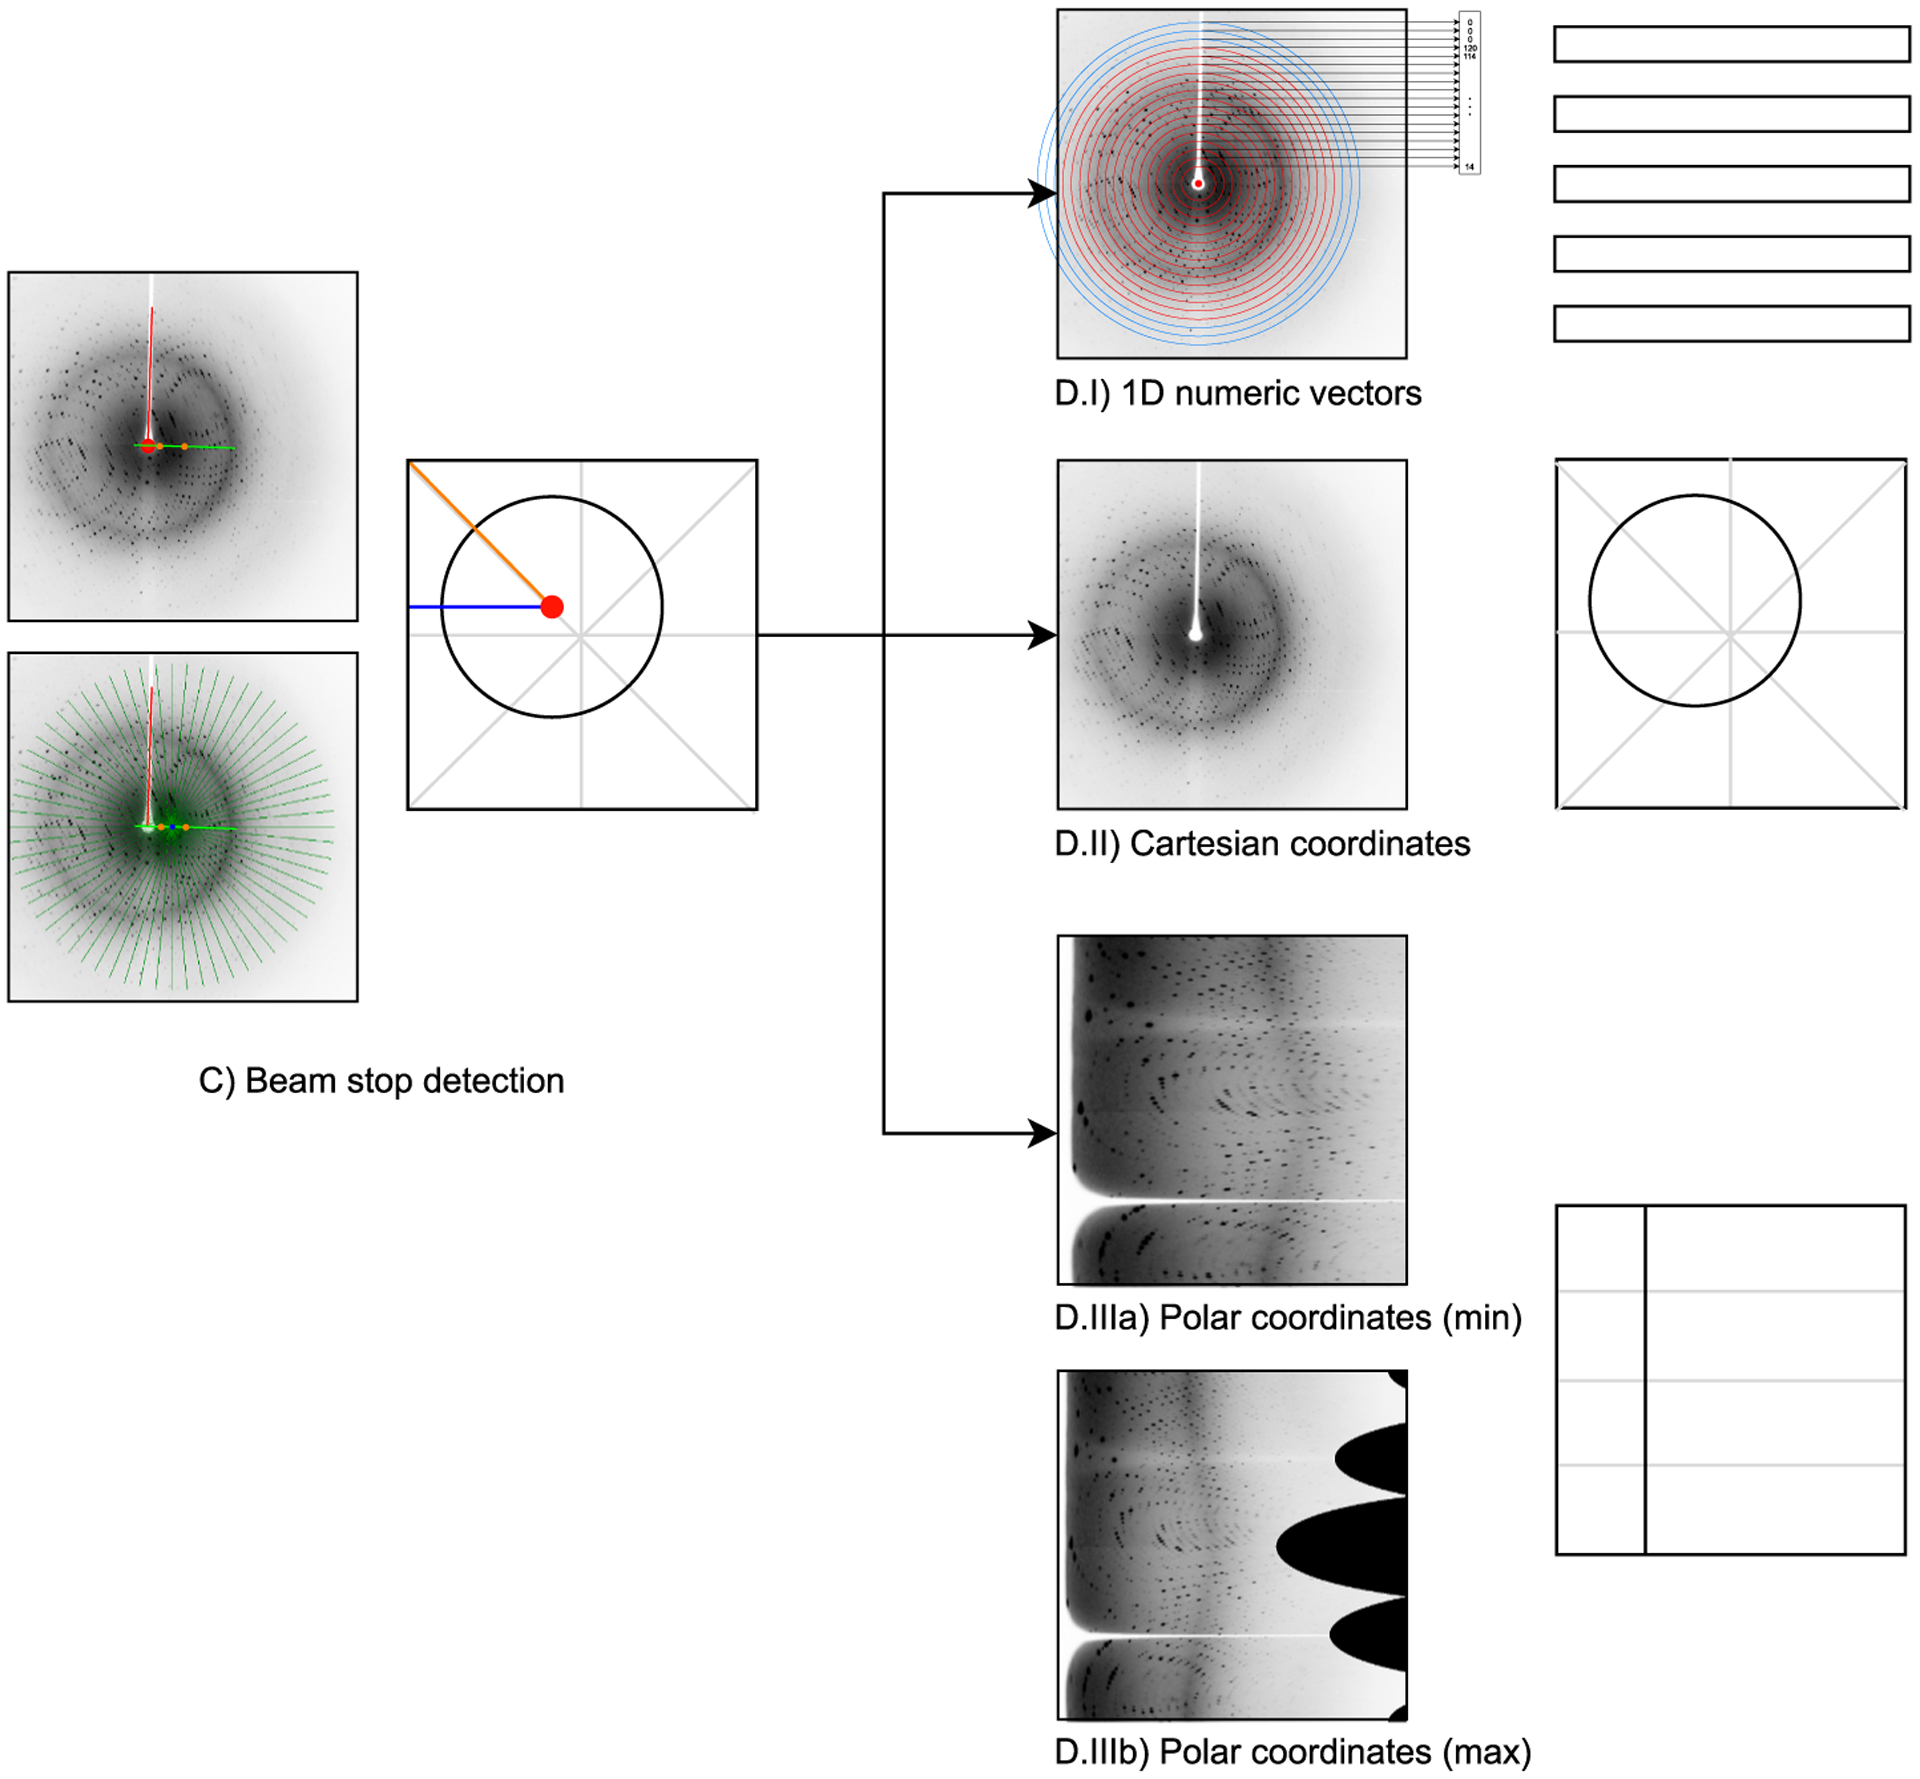
Fig. 6.

Detailed schematic of steps C and D of the system’s processing pipeline (Fig. 2). (C): Example visualization of the beam center detection procedure. Left top: The set C of center candidates is outlined as the green line, the centers of mass (Oo and Ot) are shown with orange points, and the red point marks the detected center c*. Left bottom: Rays depicted as green lines centered in an example beam center candidate ci (blue point) with the beam stop shadow highlighted with a red line. Right: schematic of the results of beam center detection; red point marks the detected center, blue and orange lines are the min and max radii used for polar coordinate interpolations. (D): Alternative image representations.
