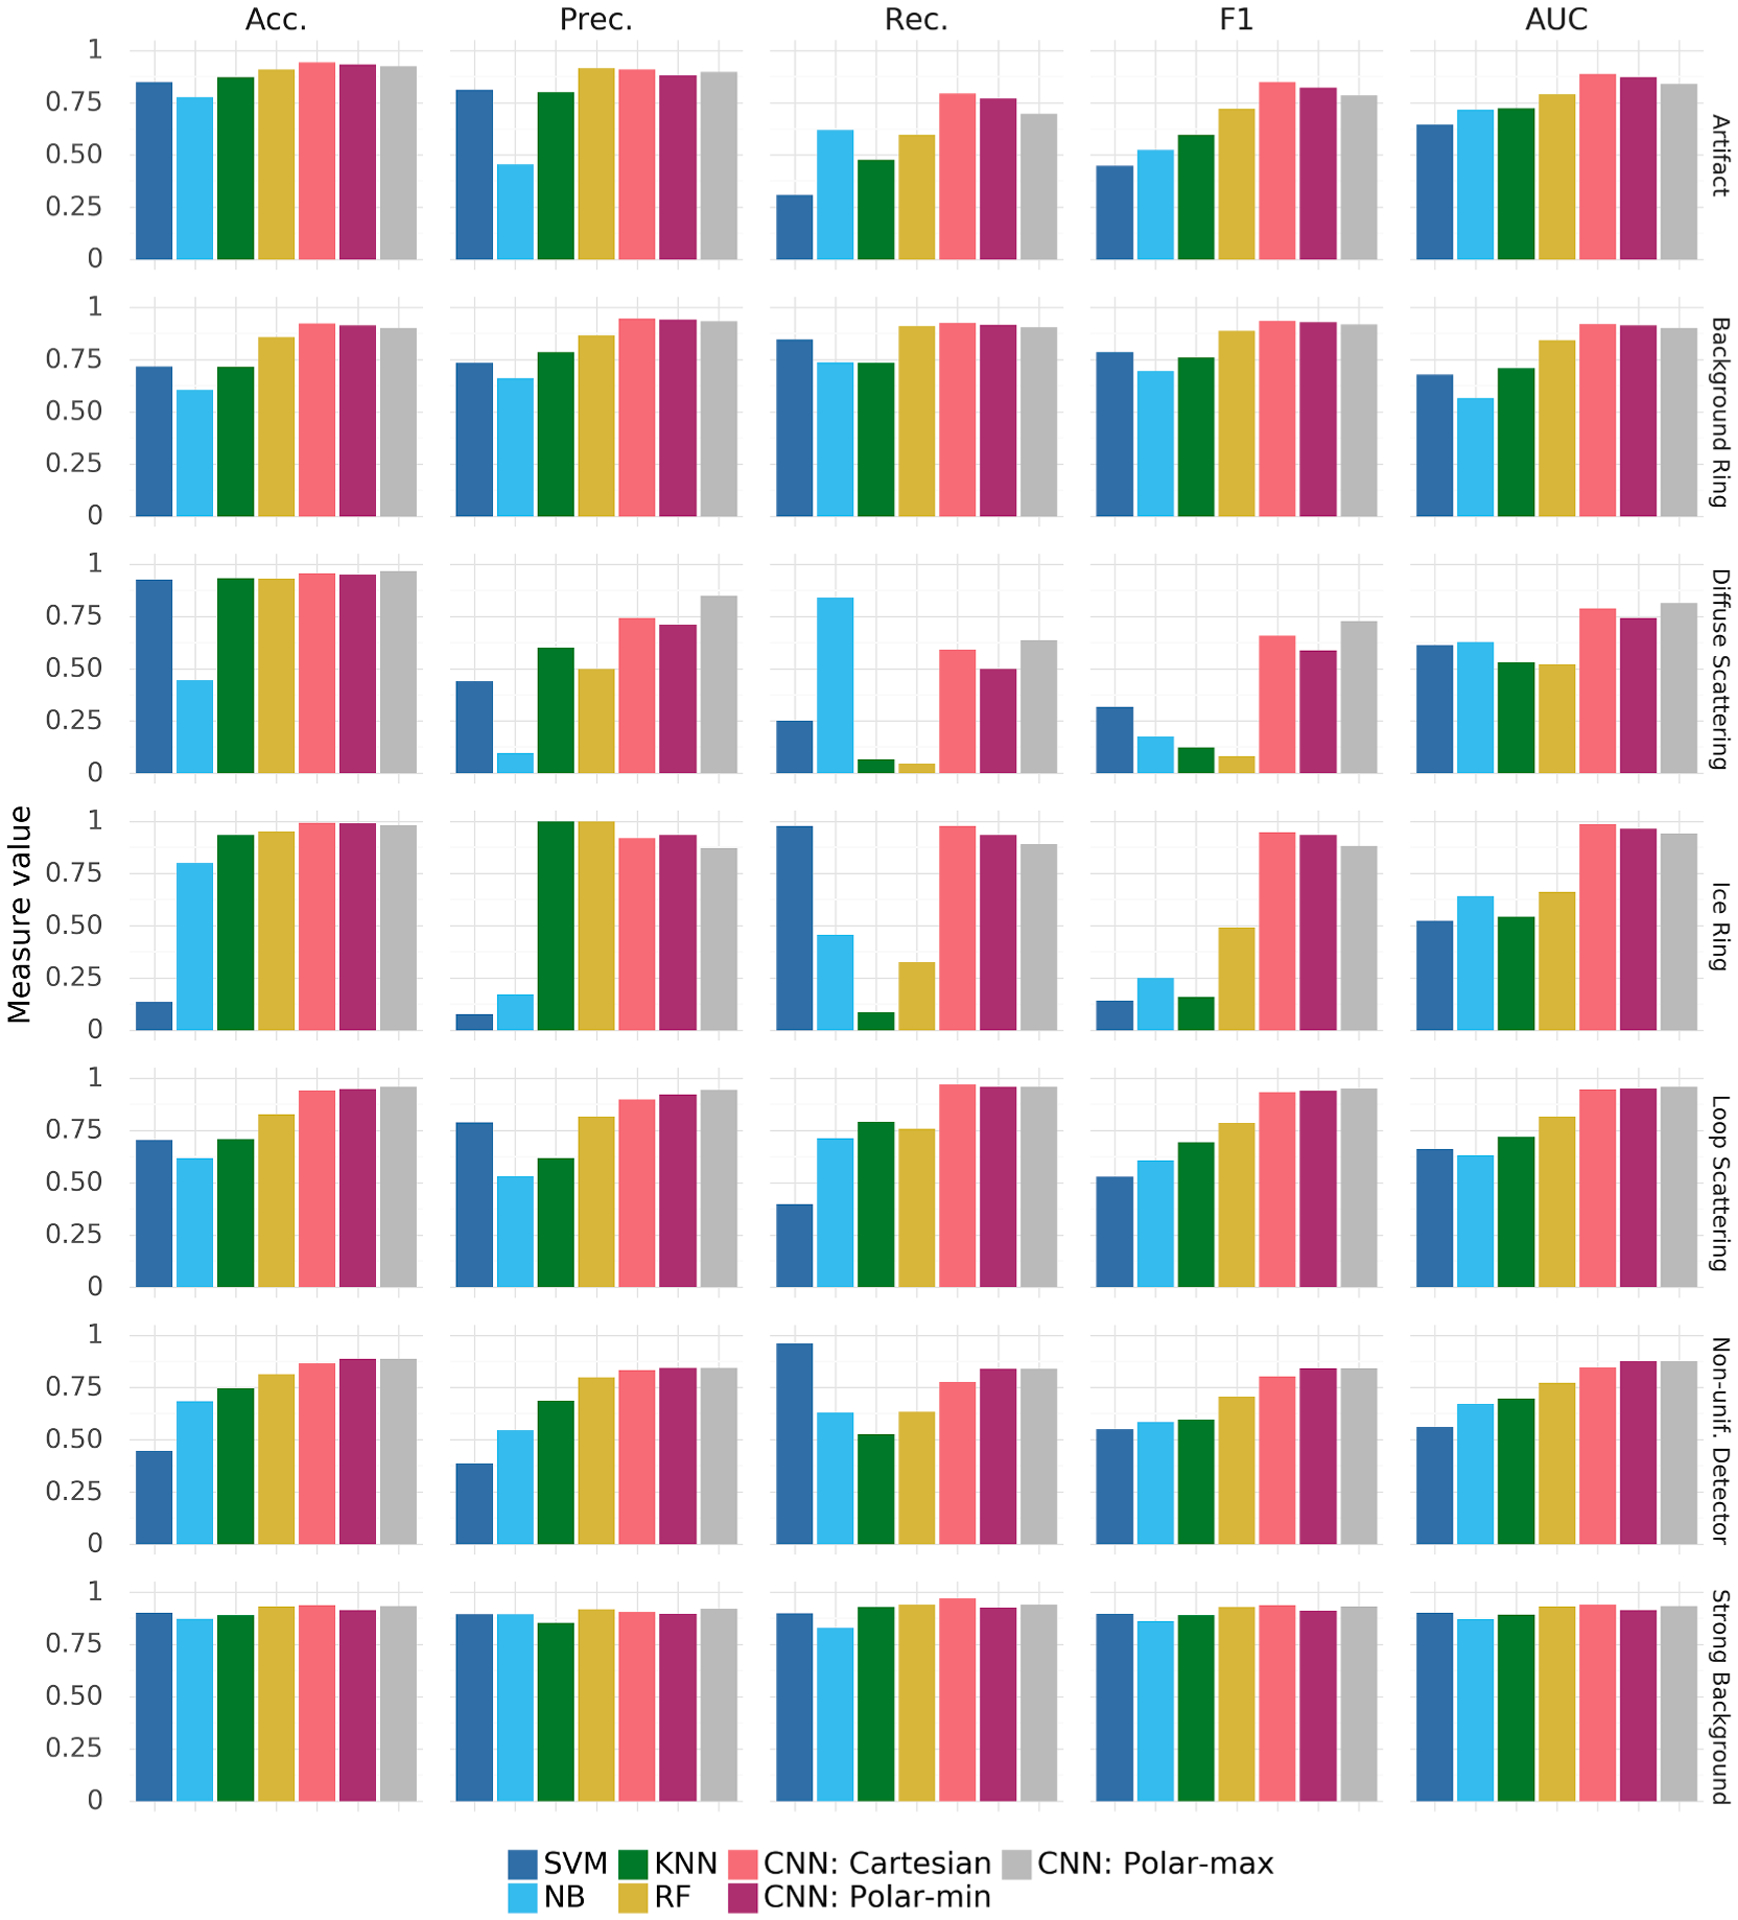
Fig. 8.

Bar plot presenting the class-specific performance (columns) of each of the seven analyzed classifiers on each of the anomaly classes (rows). Performance is measured using accuracy (Acc.), precision (Prec.), recall (Rec.), F1-score (F1), and the area under the ROC curve (AUC). The numeric data used to generate this plot are presented in Tables 4 and 5.
