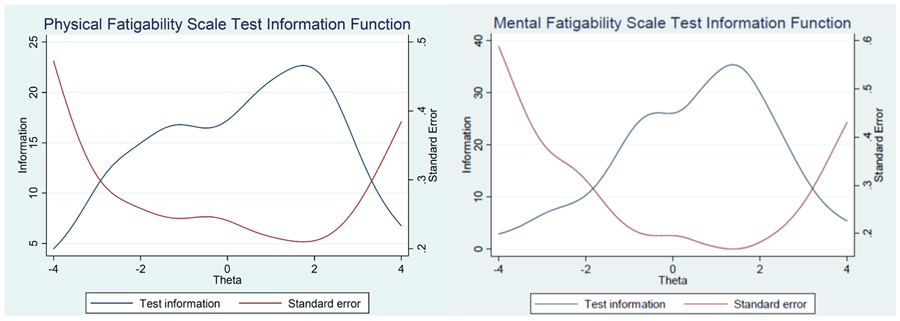
Figure 2.
Physical and Mental Fatigability Test Information and Standard Error
The lower axis shows the range of fatigability. The blue curve (test information) shows that the measurement precision, or reliability, in the theta range −2.0 to 2.5 is 0.94 for physical fatigability, and 0.91 for mental fatigability. Both scales display fairly high precision in discriminating among individuals with a relatively wide range of fatigability.

