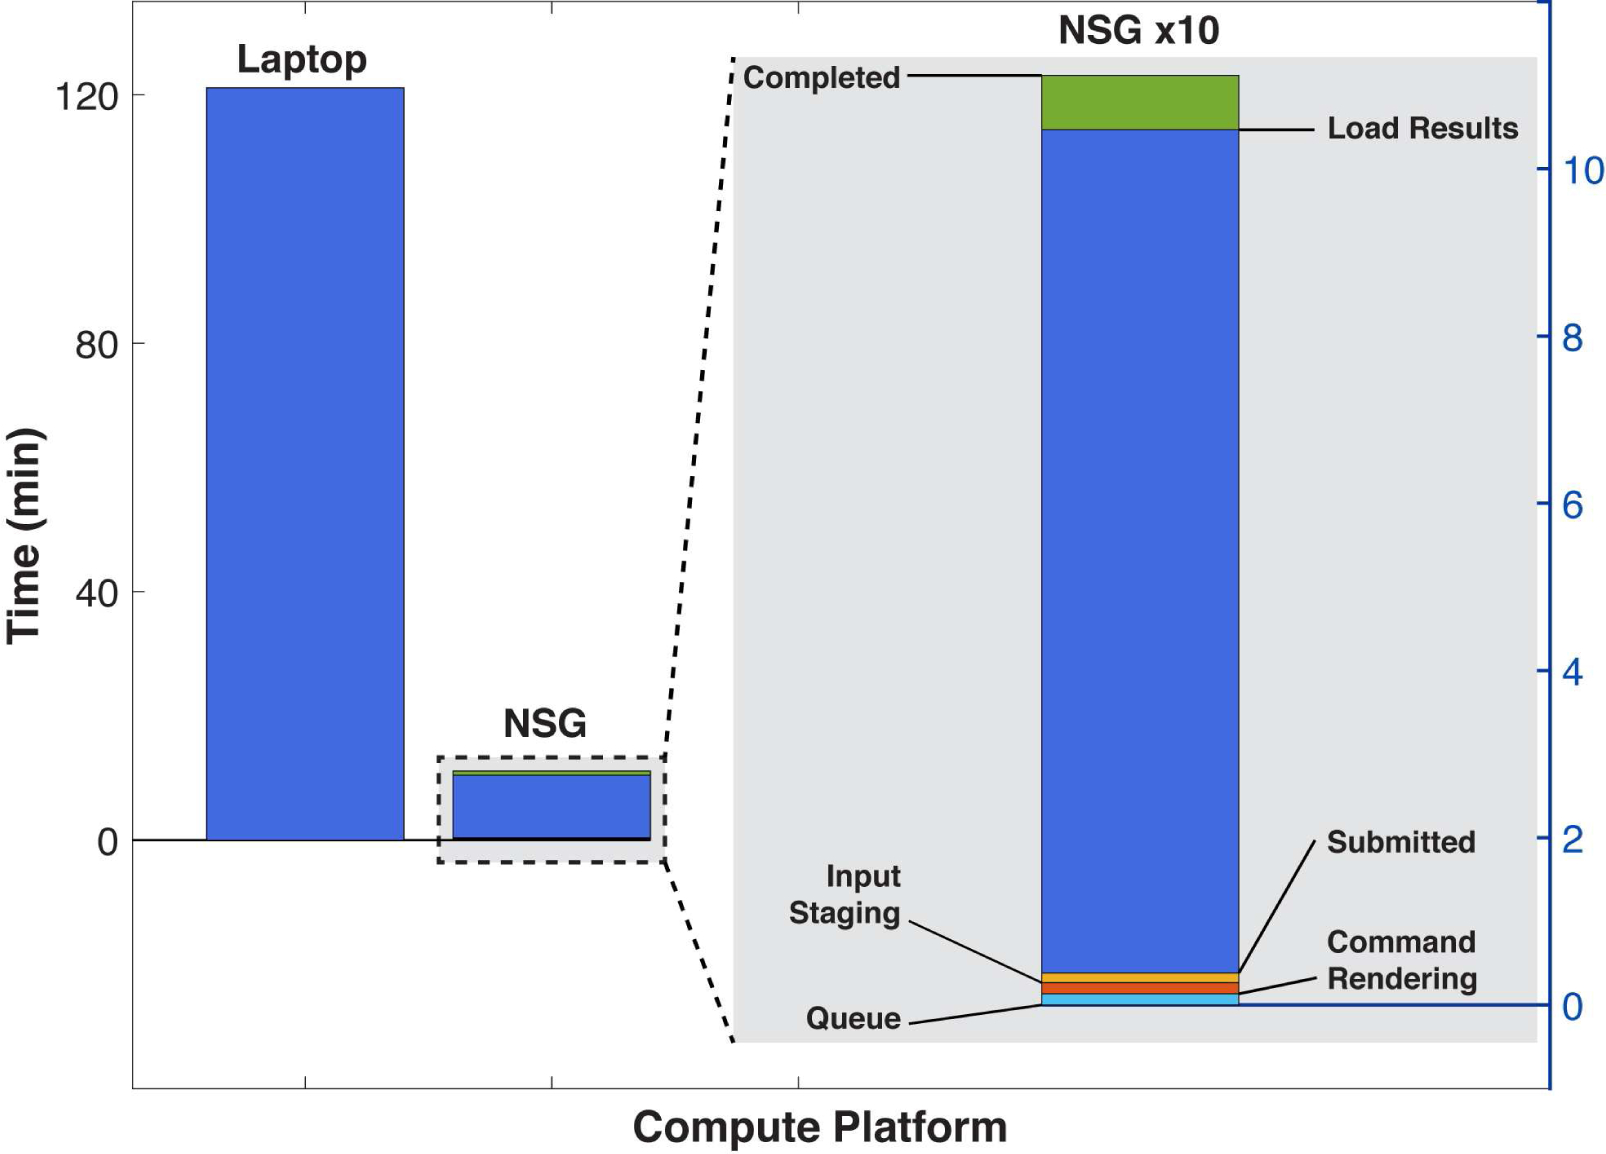
Figure 6. RELICA processing time on NSG versus a laptop.

The two leftmost bars represent recorded processing time running RELICA on the sample data using a laptop (MacBoook Pro, Intel(R) Core(TM) i7–4770HQ 4-core CPU @ 2.20GHz) and via NSG (1 node, all 24 cores of the XSEDE network cluster Comet) using 100 iterations of ICA decomposition using ‘runica’ (Scott Makeig et al., 1997). A detail of NSG processing time magnified by 10 is shown in the right gray panel. Here the time has been split to show the time the job spent on each of the NSG stages. Here the initialization stages (bottom of right bar) produced only a small delay, though this may vary with current system load. Data upload and download times (not shown) here required about as much time as the 3 job initialization stages (right column bottom), but these delays are still negligible compared to the time saved by performing the computation using NSG versus on the laptop. Upload and download times depend heavily on the Web bandwidth and traffic load between the user machine and UCSD.
