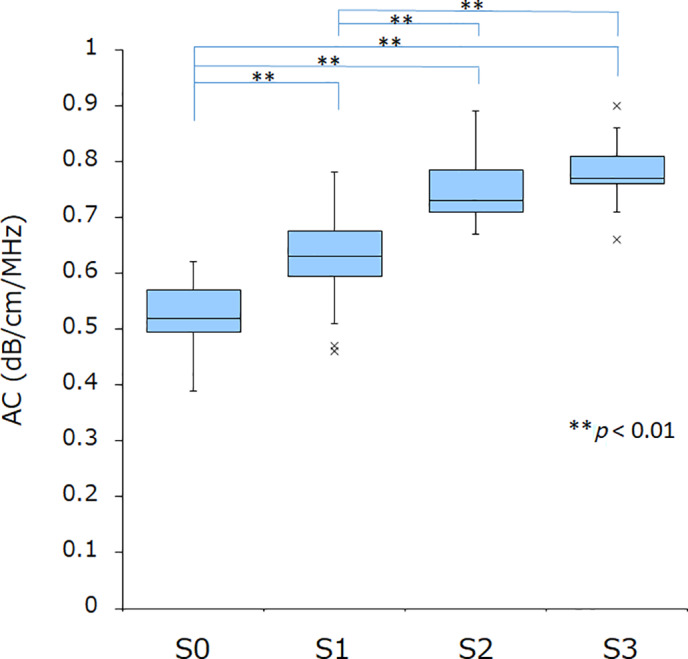
Figure 1.

Correlation between attenuation coefficient (AC) values and steatosis score. By steatosis score, the AC value was 0.52 ± 0.07 for S0, 0.63 ± 0.0 for S1, 0.74 ± 0.06 for S2, and 0.78 ± 0.06 for S3. Multiple comparison tests showed a significant difference between S0 and S1, S0 and S2, S0 and S3, S1 and S2, and S1 and S3 (all P < 0.01), demonstrating that AC increased significantly with the progression of steatosis.
