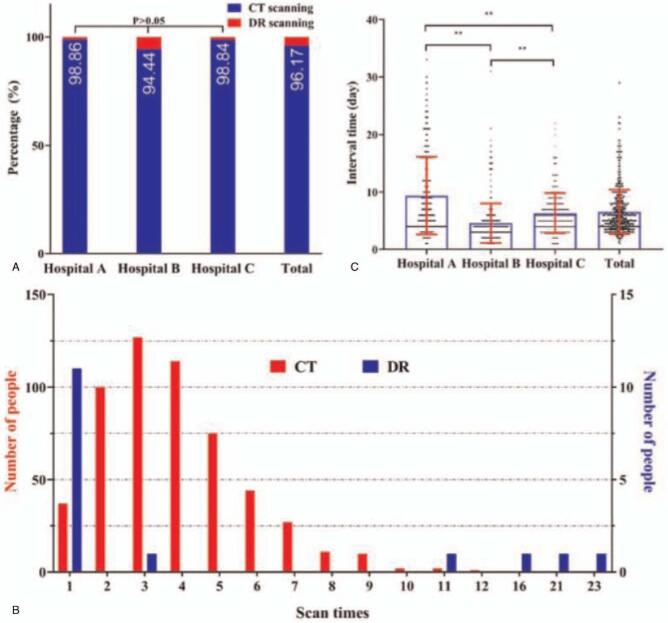
Figure 2.
The basic information about radiological examination for COVID-19. (A) The proportion of imaging techniques for CT and DR in 3 designated hospitals and the total hospitals. (B) The frequency distribution of CT and DR scanning times. (C) The interactive bar graph and scatter plot applications for showing the time intervals between 2 successive CT scans for COVID-19 patients. COVID-19 = coronavirus disease 2019, CT = computed tomography, DR = digital radiography.

