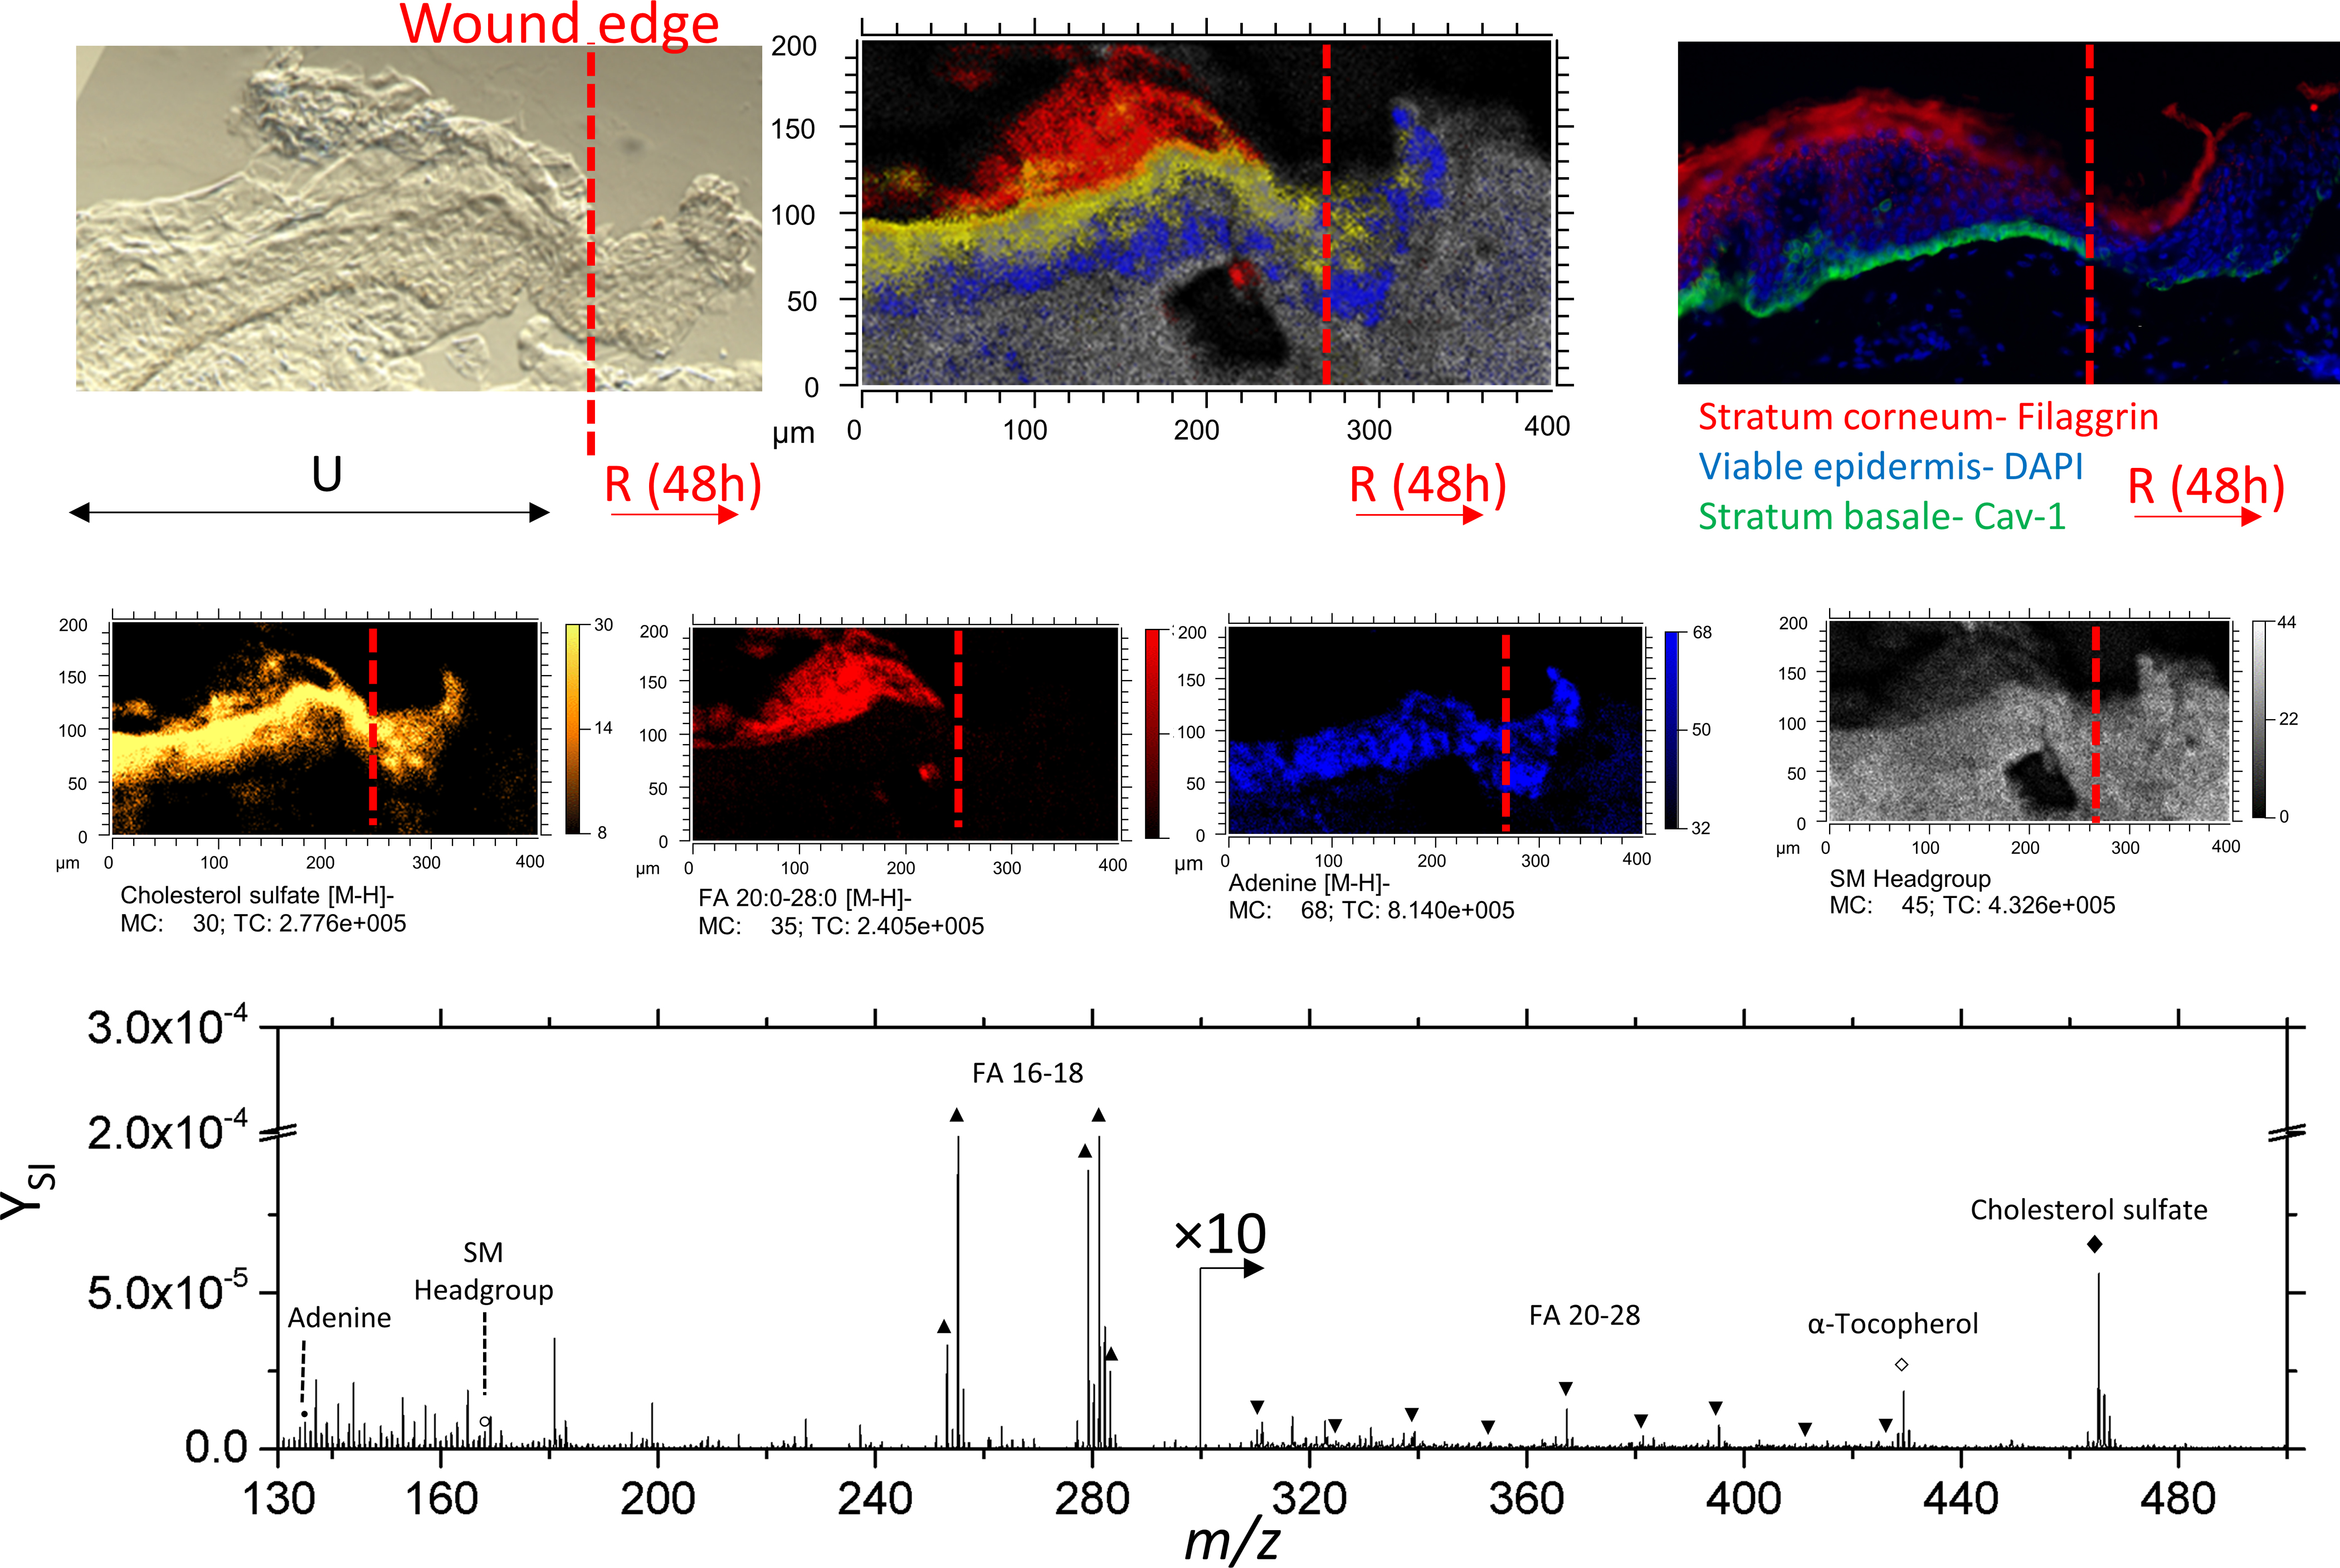
Figure 4.

Optical, SIMS imaging, and fluorescence imaging of re-epithelializing skin tissue. The ‘U’ and ‘R’ denote unwounded and re-epithelialized areas of 48h incubated skin, respectively. Individual secondary ion images comprising the SIMS overlay are shown in the middle row. Secondary ion images of sphingomyelin is represented as the of ion at 168.0 m/z. Here, signal of fatty acids 20:0–28:0 were combined and shown as a summed secondary ion image.
