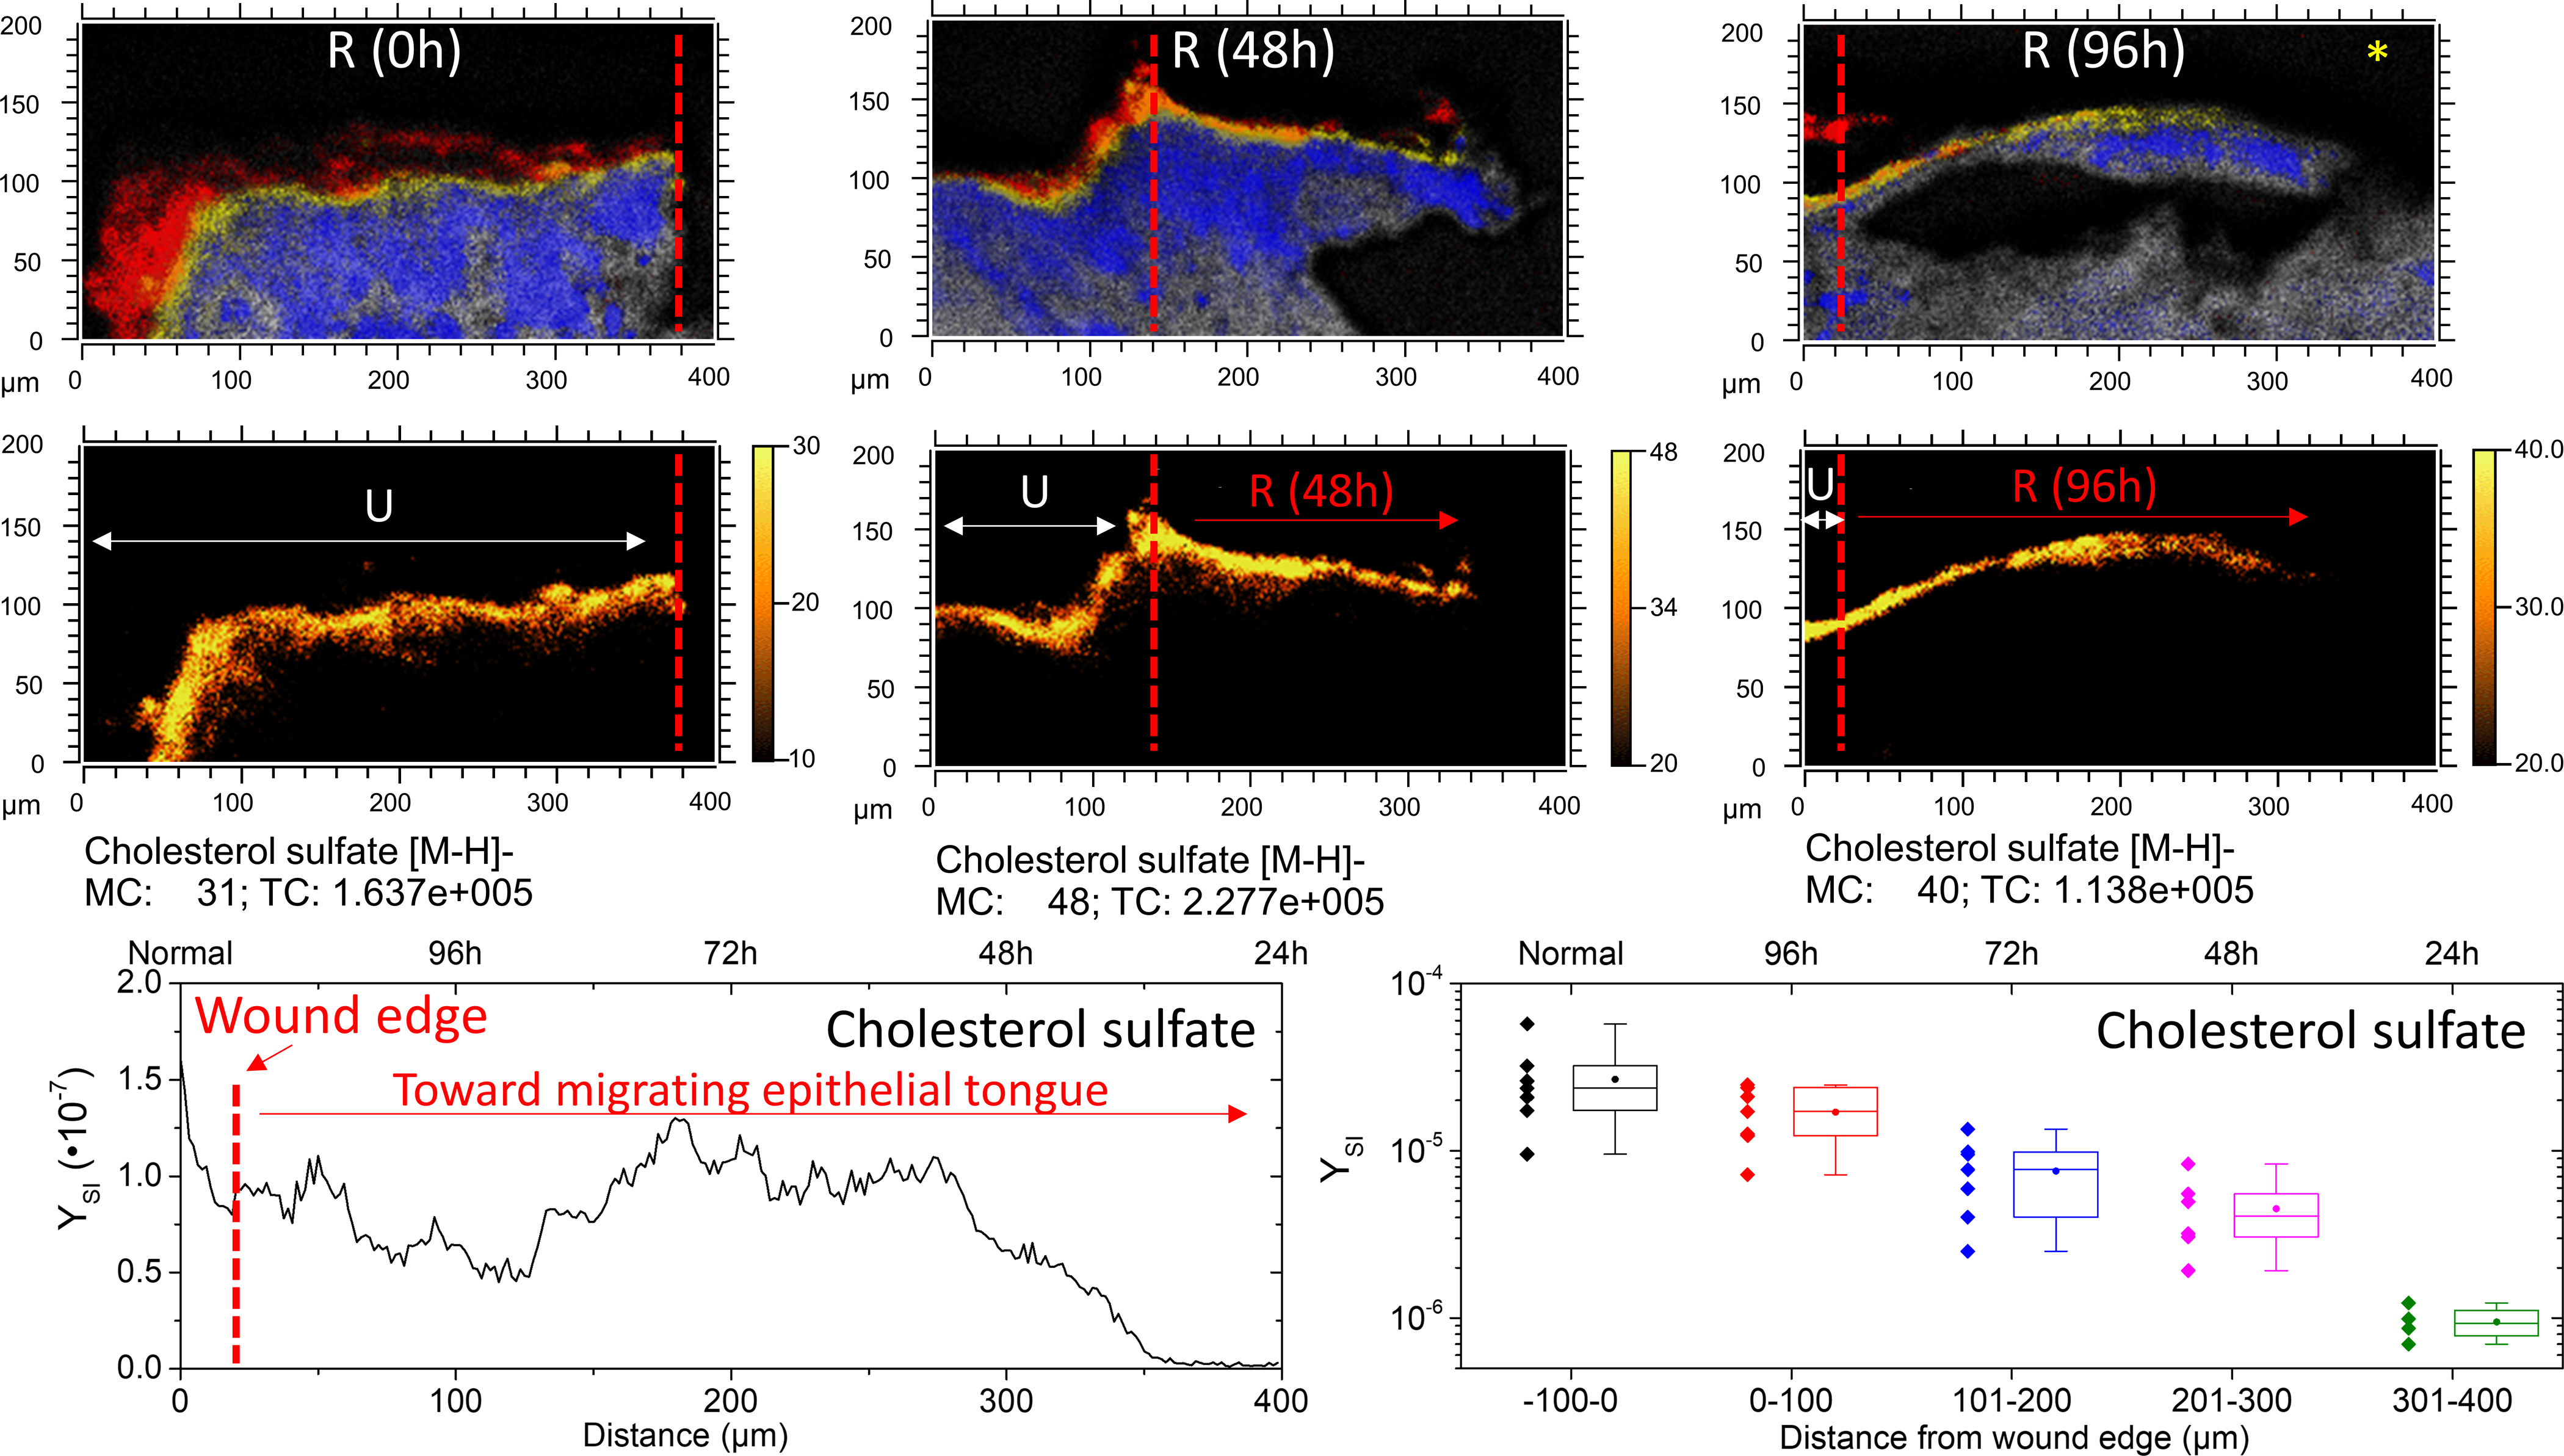
Figure 5.

Cholesterol sulfate progression in re-epithelializing tissue. The top row shows SIMS overlays of FA 20:0–28:0 (Red), cholesterol sulfate (yellow), adenine (blue), and sphingomyelin (grey). The red dashed line denotes the wound edge, as corroborated by microscopy. A typical linescan plot of the 96h re-epithelialized tissue (denoted with an *) in the lower left shows the integrated y-area intensity of cholesterol sulfate as a function of distance. Profiles were divided into quarters roughly equivalent to 24 h of re-epitheliazation, approximately 100 μm segments. In the lower right, a boxplot shows the minimum, maximum, lower quartile, upper quartile, median (line) and mean (circle) of observations pooled from 48h and 96h incubated tissues according to distance from the initial wound. N=7 for −100–200 μm; N=6 for 201–300; N=4 for 301–400 μm.
