
Fig. 3 |. The normalized transfer function under different NAc values.
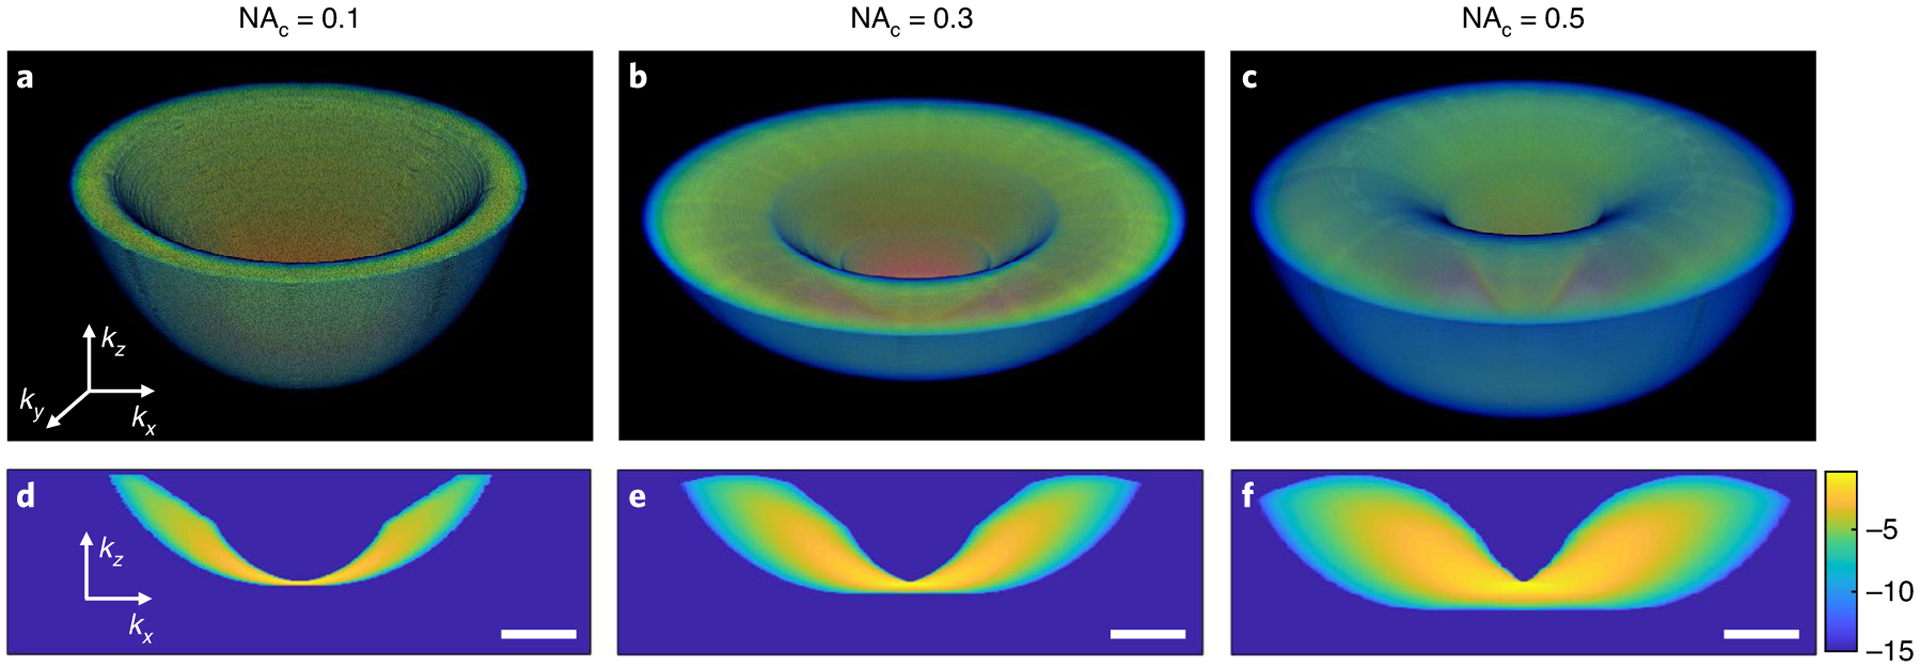
a–c, 3D views of the transfer function with NAc = 0.1 (a), 0.3 (b) and 0.5 (c). d–f, The corresponding cross-sectional views of the transfer function with the same condenser NA values from a–c, respectively. All values are presented on a logarithmic scale in arbitrary units. Scale bars, 10 rad μm−1.