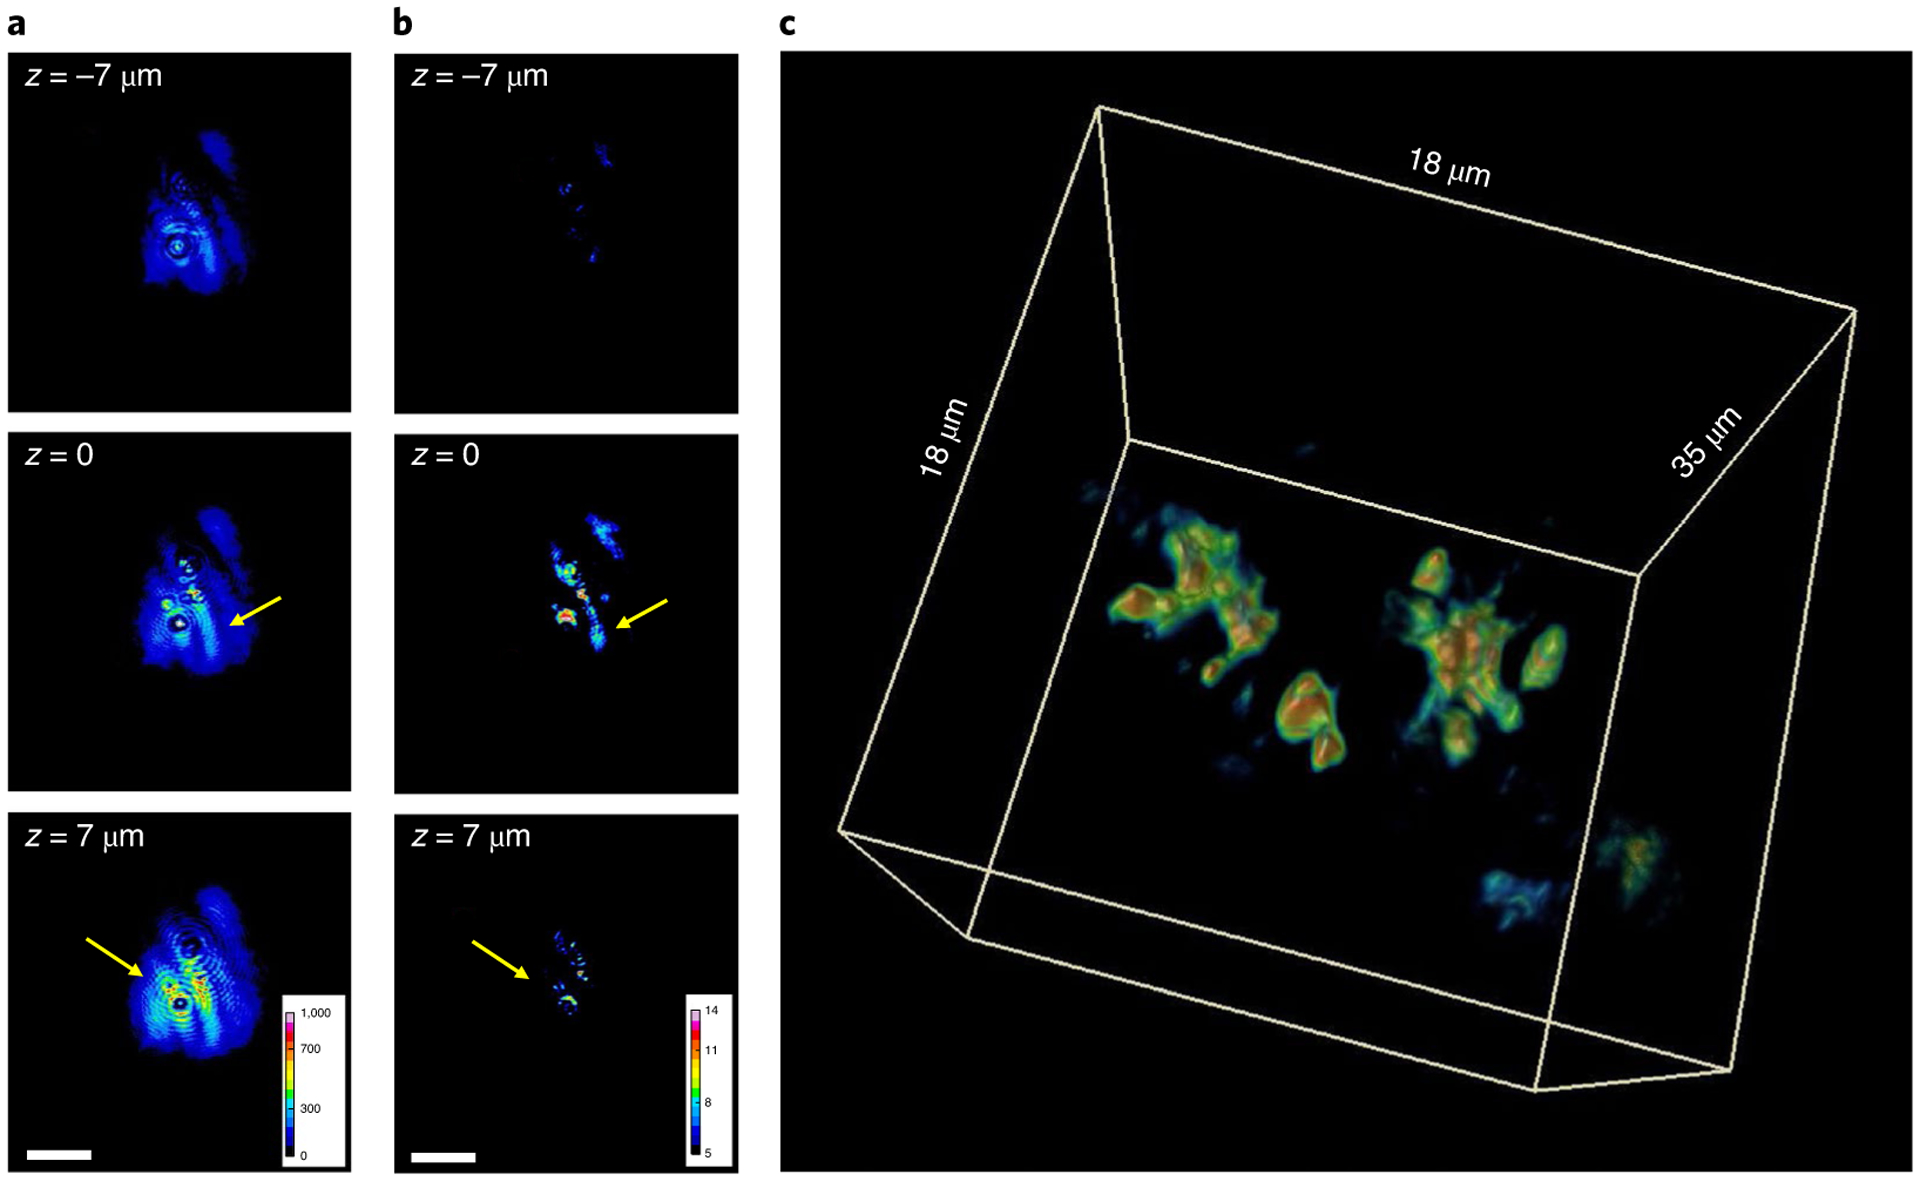
Fig. 4 |. HOT of an inhomogeneous nonlinear crystal.

a, Three transverse SHG intensity images of a BBO crystal, measured at the focal plane (z = 0) and 7 μm above and below the focal plane. b, HOT reconstruction results of the same z-slice in a. Colour bars in a and b are in arbitrary units. c, A 3D view of the HOT reconstruction. A rotating rendering of this reconstruction can be viewed in Supplementary Video 1. Scale bars, 10 μm.
