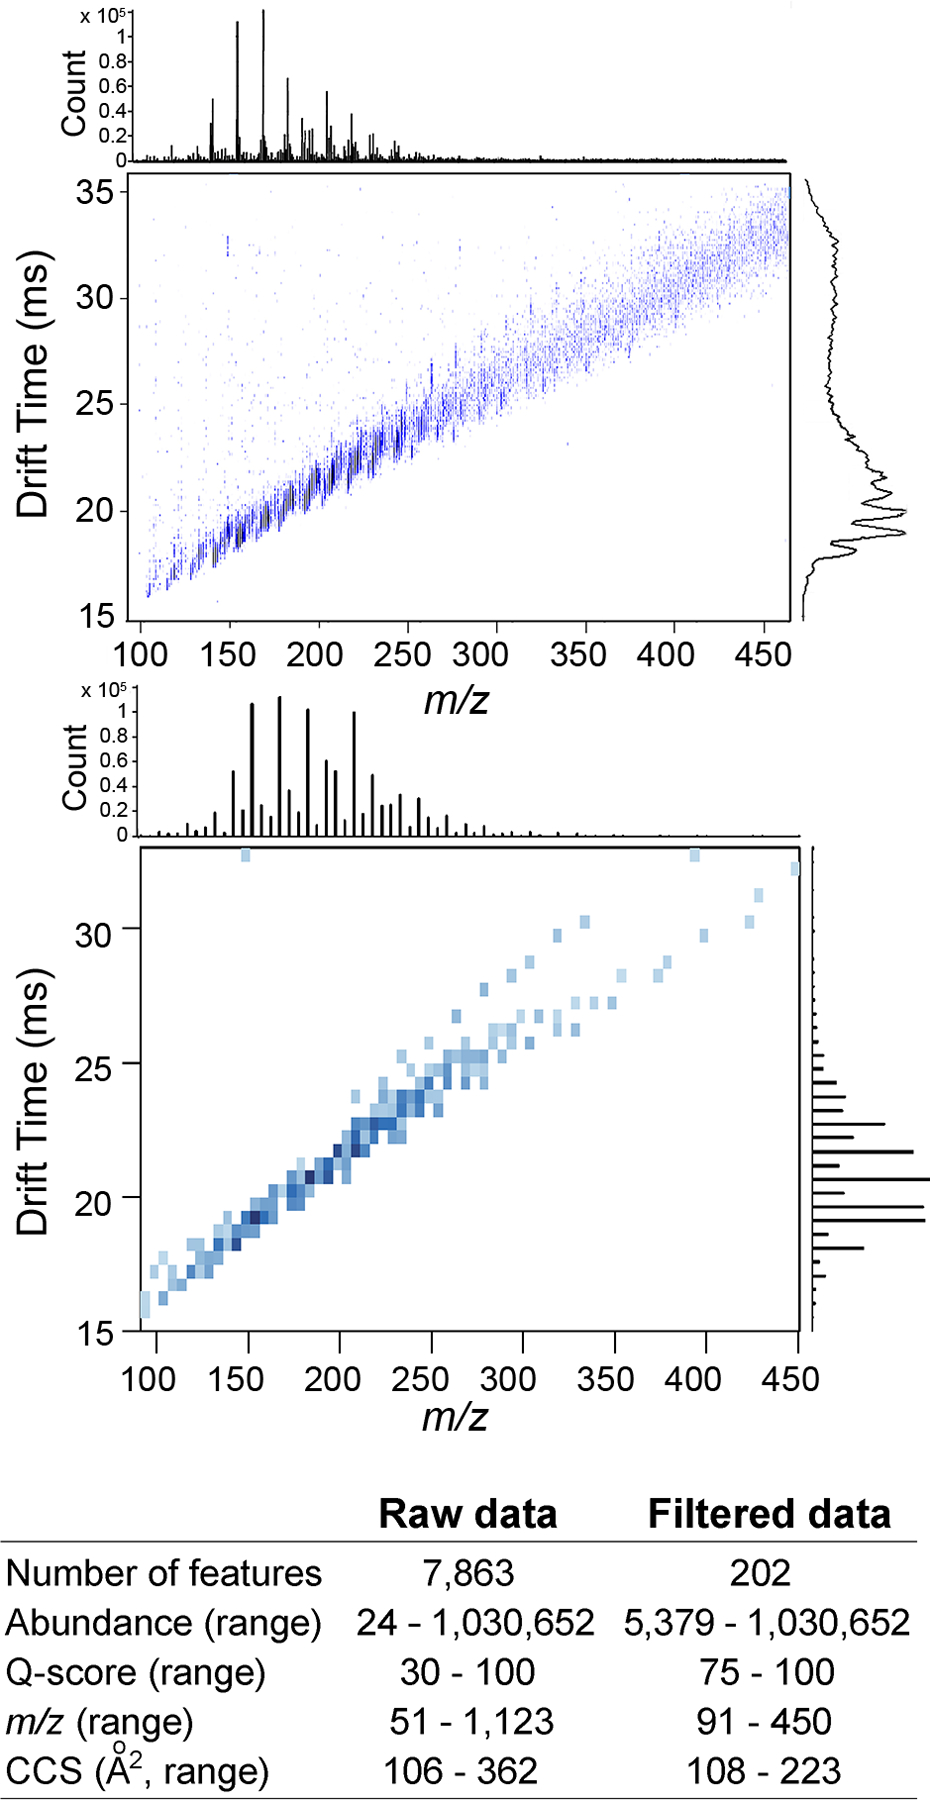
Figure 2.

IMS-MS spectra for PIANO gasoline standard. Raw data (top, Supplemental Table 3) in APPI positive-ion mode and features filtered (bottom) by abundance >5000 and Q-score >75. X-axis is m/z, and Y-axis is drift time. Density plots for each parameter are shown. A summary table of the feature characteristics is shown for both raw and filtered data sets.
