Figure 7.

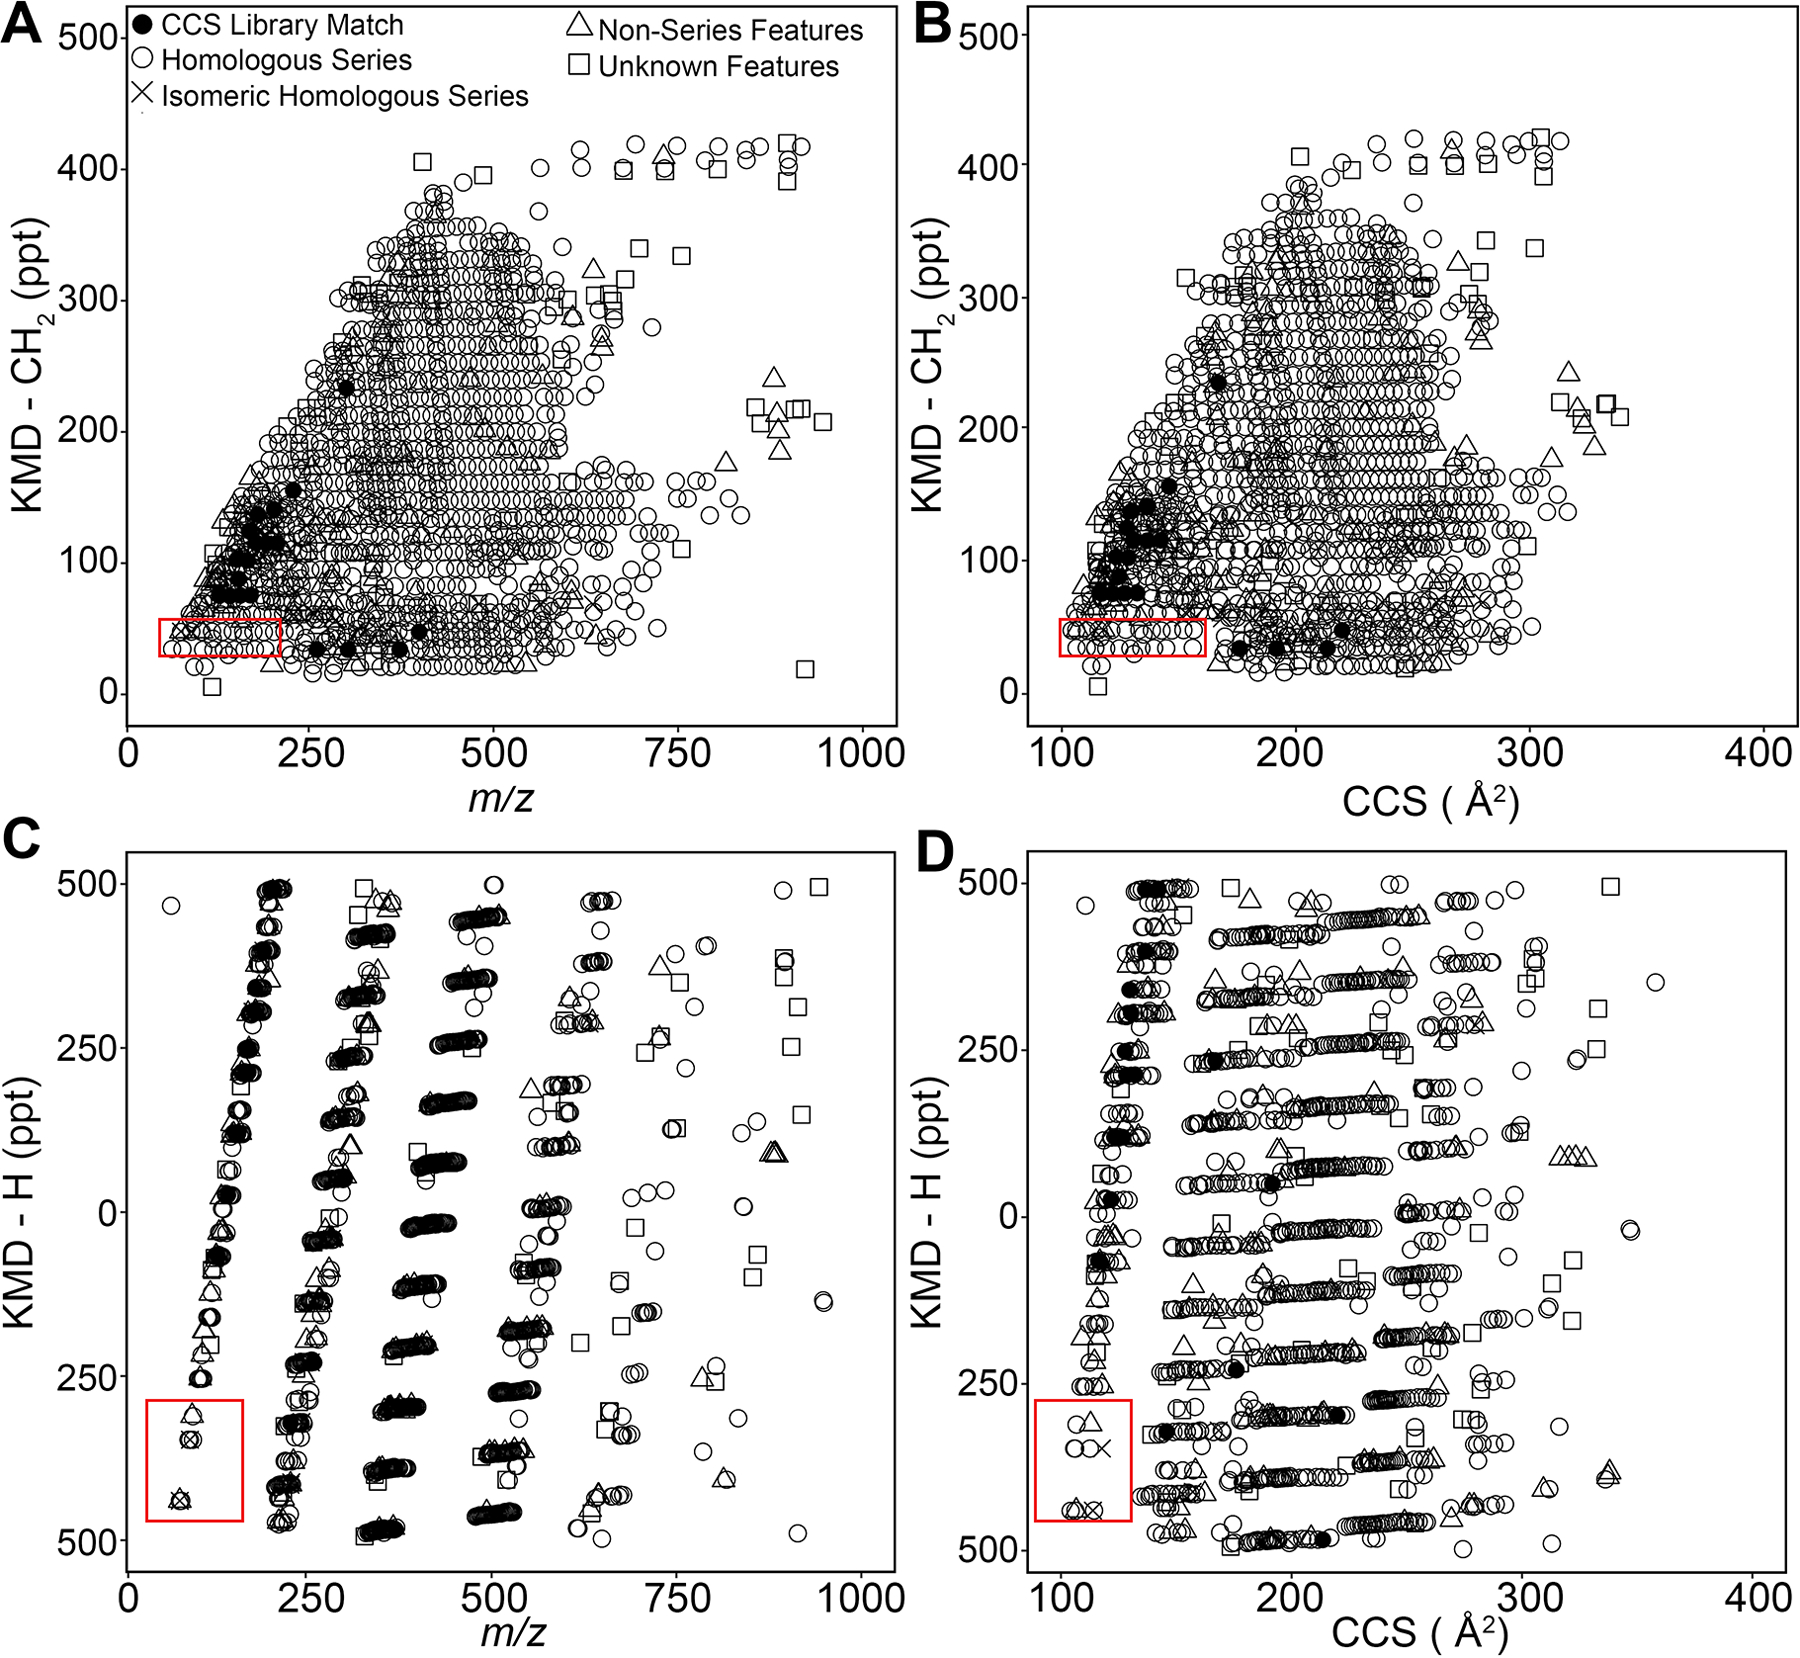
KMD analyses of IMS-MS data for a Louisiana crude oil. Features (Supplemental Table 16) were plotted for analyses using CH2 and H KMD scales. (A) KMD-CH2 vs m/z plot showing horizontal homologous series of filtered features (n = 1258). (B) KMD-CH2 vs DTCCSN2 plot shows library-matched anchor features in black (n = 24). (C) KMD-H vs m/z plot organizes homologous series by carbon number and molecular class. (D) KMD-H vs DTCCSN2 plot. Consistent with PIANO gasoline standard KMD plots (Figure 3), red rectangles (see Figure 8) depict features in isomeric series (×, n = 4), distinguishable by DTCCSN2. Elemental shifts were used to assign formulas to homologous series (open circles) from nonseries features (open triangles). Features without molecular formula assignments are shown as open squares.
