. 2021 Jul 9;2(4):1285–1290. doi: 10.1039/d1cb00117e

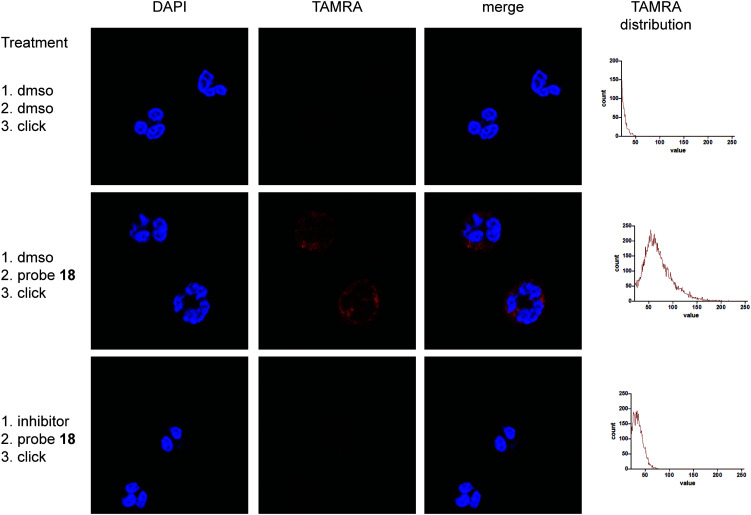
Fig. 4. Labelling of neutrophils with ABP 18, subsequent ‘click’-reaction with TAMRA and fluorescent microscopy. Depicted are representative images showing two neutrophil cells. Clear labelling can be seen in the probe-treated cells (middle panels) in comparison with the dmso vehicle-treated ones (upper panels). Additionally, treatment of neutrophils with a CatG inhibitor prior to probe treatment diminishes labelling by ABP 18 (lower panels). Histograms that show the distribution of brightness in the TAMRA channel also reveal a clear difference between the probe treated samples in comparison with vehicle and inhibitor control. Brightness of DAPI channel images was adjusted for better representation.

Fig. 4