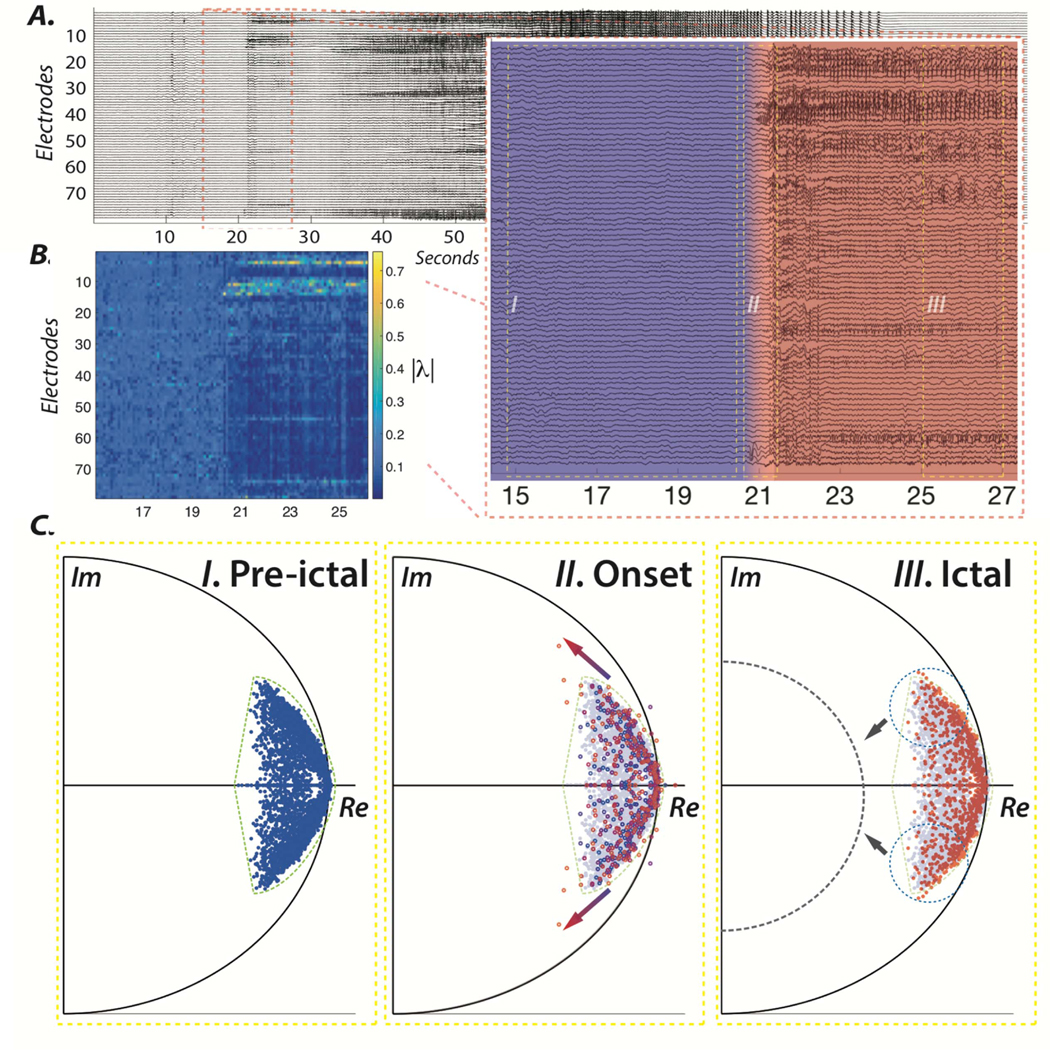
Figure 3.

Regulation of ictal activity using a dynamical stability control strategy. (A) iEEG signals from 79 electrodes in subject 3 over a single ictal period, beginning 20 s before seizure onset and ending 20 s after seizure termination, as shown previously in figure 1. The inset on the bottom right shows the emergence of epileptic activity and the transition from pre-ictal (blue) to ictal (red) dynamics following the seizure onset. (B) The evolution of the absolute value of the third eigenvector associated with high frequencies (mean = ~ 38 Hz, std = 2.86) displayed in the heat map. (C) Argand diagrams display the position of the eigenvalues over the course of (I) pre-ictal, (II) onset, and (III) ictal periods. Ictal onset is marked by the excursion of several eigenvalues from the pre-ictal zone (dashed green). An early intervention control strategy could entail closed-loop actuation, with the aim of driving the eigenvalues of the system closer to the center, towards the asymptotically stable zone (dashed gray) and, thus, in effect damping the focal epileptic dynamics via field effects.
