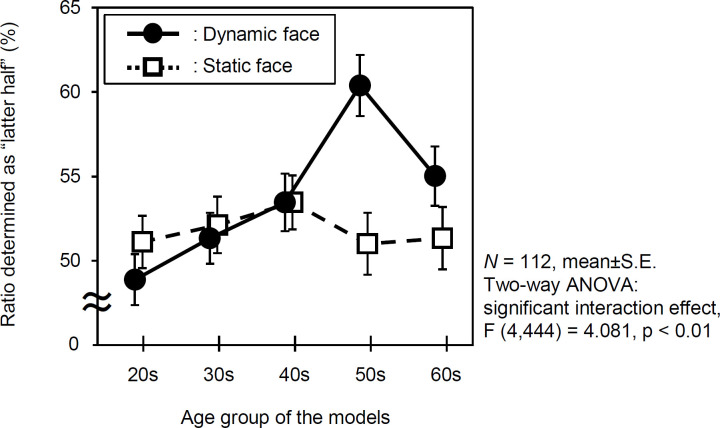
Fig 7. Effects of facial movements on age impression.
The graph shows the percentages of 112 observers who thought the models to be in the older group, and their impressions after the dynamic and static conditions. The closed circles (●) and open squares (□) show the percentages of observers stimulated by dynamic and static stimulations, respectively. The marks and the vertical lines on the marks are mean values and standard errors, respectively.

