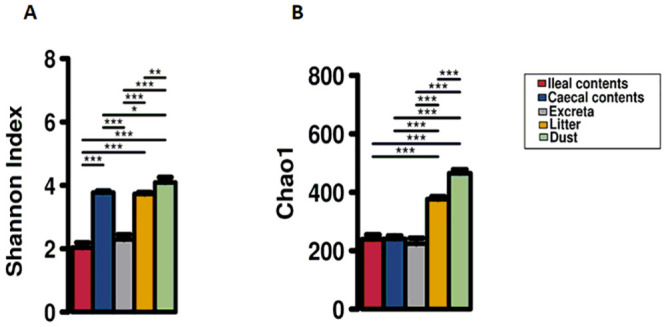
Fig 1. Alpha diversity assessed by Shannon diversity (A) and Chao1 richness (B).

*Denotes significant difference at the P < 0.05 level, ** denotes significant difference at P < 0.01 level, *** denotes significant difference at the P < 0.001 level between sample types connected by a line.
