
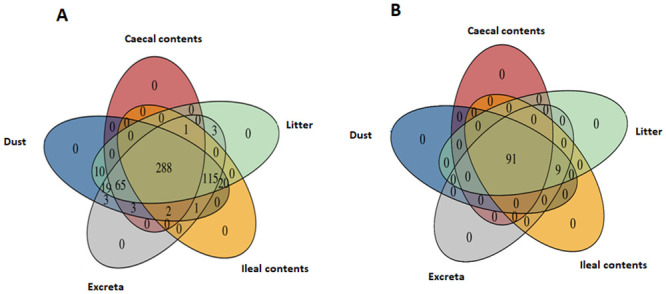
Fig 5. Venn diagram showing common bacterial OTUs between sample types A) across all OTUs and in the B) top 100 most abundant OTUs.
Official websites use .gov
A
.gov website belongs to an official
government organization in the United States.
Secure .gov websites use HTTPS
A lock (
) or https:// means you've safely
connected to the .gov website. Share sensitive
information only on official, secure websites.