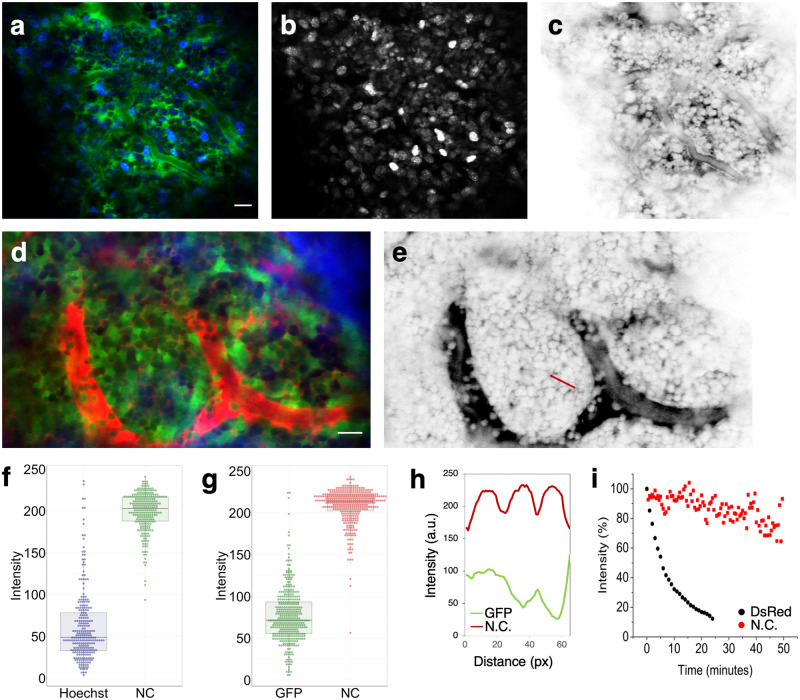
Fig 3. Comparison of negative contrast imaging with standard “universal” fluorescence labeling methods.
a, Colocalized image of BM cells, labeled with Hoechst 33342 (blue) and interstitial space, labeled with TRITC-dextran (green). b, The Hoechst channel shown in gray scale. c, The TRITC channel in gray scale after LUT inversion. N = 2 mice. d, Colocalized image of BM cells expressing actin-GFP (green) and interstitial space labeled by rhodamine B-dextran (red). Bone second-harmonic generation signal is shown in blue. e, The rhodamine B channel in gray scale after LUT inversion. N = 1 mouse with 6 different z-stack locations. f, Boxplots of cell intensities in (a). 226 cells were included. g, Boxplots of cell intensities in (d). 369 cells were included. h, GFP (green) and negative contrast (red) intensity profiles along the red line marked in (e), which spans the width of 3 cells. The negative contrast profile is more consistent than the GFP profile from cell to cell, and the cell boundaries are well-defined. i, Photobleaching kinetics of actin-DsRed labeled cells (black) and FITC-dextran labeled interstitium (red). Signal was acquired from BM in vivo, and the excitation laser was continuously scanned over the field of imaging during signal acquisition. N = 2 mice. Scale bar for all images = 20 μm.

