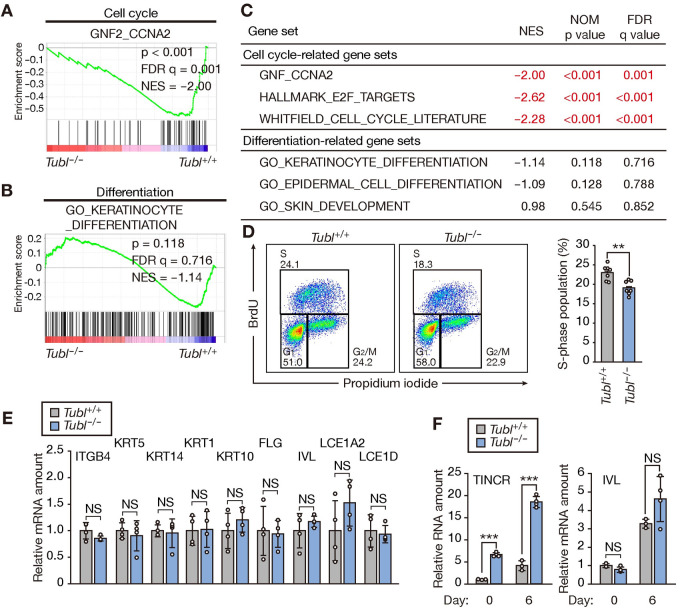
Fig 5. TUBL deficiency delays cell cycle progression in mouse primary keratinocytes.
(A, B) GSEA plots for gene sets related to the cell cycle (A) or keratinocyte differentiation (B) constructed from RNA-seq data for the epidermis of Tubl+/+ or Tubl−/− mice at 8 weeks of age. FDR, false discovery rate; NES, normalized enrichment score. (C) Results of GSEA for gene sets related to the cell cycle or keratinocyte differentiation. NOM, nominal. (D) Flow cytometric traces and quantification of BrdU incorporation in primary keratinocytes from Tubl+/+ or Tubl−/− mice. Data in the right panel are means ± SD (n = 7 or 8 independent experiments). **p < 0.01 (Student’s t test). (E) RT-qPCR analysis of keratinocyte differentiation–related gene expression in the epidermis of Tubl+/+ and Tubl−/− mice. Data are means ± SD (n = 4 independent experiments). NS, Student’s t test. (F) RT-qPCR analysis of TINCR and involucrin mRNA abundance in mouse primary keratinocytes established from Tubl+/+ or Tubl−/− mice and subjected to calcium-induced differentiation in vitro for 0 or 6 days. Data are means ± SD (n = 3 or 4 independent experiments). ***p < 0.005, NS (Student’s t test).

