. 2021 Mar 20;2(3):906–916. doi: 10.1039/d1cb00002k

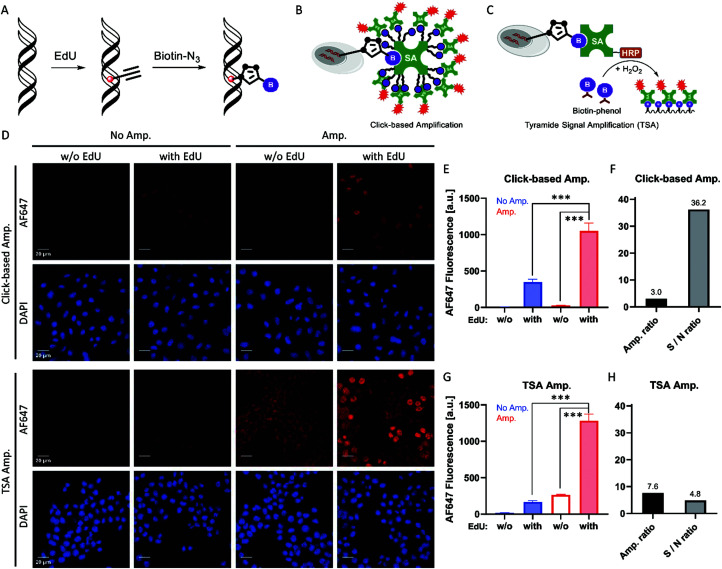
Fig. 4. Click-based amplification achieved a much higher signal-to-noise ratio than TSA on fixed HeLa cells with EdU labelling. (A) Scheme of DNA labelled with EdU and the click conversion of EdU to biotin. (B) Scheme of Click-based amplification. (C) Scheme of TSA. (D) Confocal imaging of fixed HeLa cells with Click-based amplification and TSA. HeLa cells were treated with 10 μM EdU in DMEM at 37 °C overnight. DAPI stained the nuclei of the HeLa cells. Scale bars, 20 μm. (E) Quantification of the cellular AF647 fluorescence intensities in (D) with Click-based amplification. For the groups w/o EdU labelling, all the cell nuclei were dark, and 20 cells were chosen randomly to measure the average fluorescence intensity. For the groups with EdU labelling, all the lighted nuclei were measured to determine the average fluorescence intensity. (F) Amplification ratios (Amp./No Amp.) and signal-to-noise ratios (EdU/vehicle) with Click-based amplification. (G) Quantification of the cellular AF647 fluorescence intensities in (D) with TSA amplification. For the groups w/o EdU labelling, 20 cells were chosen randomly to measure the average fluorescence intensity. For the groups with EdU labelling, all the lighted nuclei were measured to determine the average fluorescence intensity. (H) Amplification ratios (Amp./No Amp.) and signal-to-noise ratios (EdU/vehicle) with TSA. ***p < 0.001.

Fig. 4