. 2021 Mar 20;2(3):906–916. doi: 10.1039/d1cb00002k

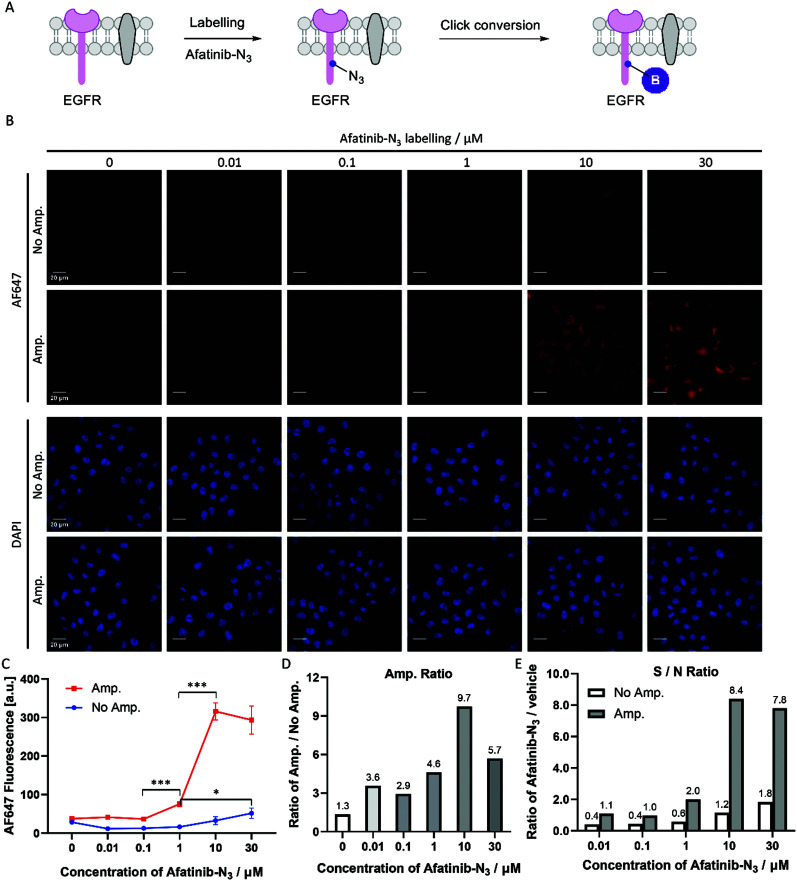
Fig. 5. Click-based amplification on fixed HeLa cells with afatinib-N3 labelling. (A) Scheme of afatinib-N3 labelling on EGFR protein and the click conversion of N3 to biotin. (B) Confocal imaging of fixed HeLa cells without and with Click-based amplification (No Amp. and Amp.). HeLa cells were treated with a concentration gradient of afatinib-N3 from 0.01 μM to 30 μM in DMEM at 37 °C for 1 h. DAPI stained the nuclei of the HeLa cells. Scale bars, 20 μm. (C) Quantification of the cellular AF647 fluorescence intensities in (B) with ImageJ. The red line represents the fluorescence intensity of HeLa cells with Click-based amplification (Amp.), and each data point is the average fluorescence intensity of 20 cells chosen randomly from the microscopy imaging. The blue line represents the fluorescence intensity of HeLa cells without Click-based amplification (No Amp.). Error bar: the standard error (SE). (D) Amplification ratios (Amp./No Amp.). (E) Signal-to-noise ratios (afatinib-N3/vehicle). ***p < 0.001, *p < 0.05.

Fig. 5