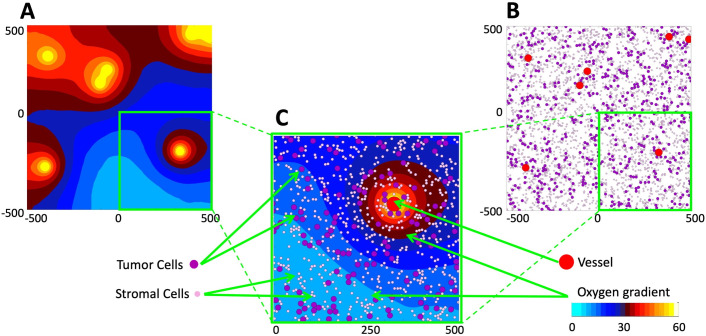
Fig 1. Mathematical model of the tumor tissue microenvironment.
A. A contour map of the simulated oxygen distribution. The color scheme corresponds to that used in EPR imaging for the partial pressure of oxygen (cyan: low pO2; white: high pO2). B. Locations of tumor vasculature (red circles), tumor cells (purple circles), and stromal cells (pink circles) within the same computational domain; this is used to define tissue cellularity and vascularity. The color scheme corresponds to typical colors in histology images. C. Magnification of a quarter of the computational domain showing all model components together: the vessels, tumor and stromal cells, and oxygen distribution. All variables are dimensional (length is in μm, oxygen partial pressure in mmHg, as listed in Table 1).

