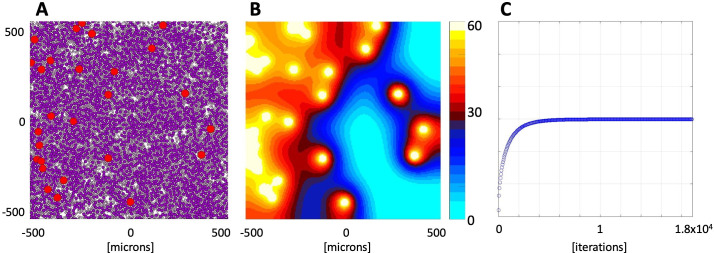
Fig 2. Stabilized oxygen distribution for an exemplary tissue morphology.
A. In silico tissue morphology comprised of 3.5% of vasculature (red circles), 55% of tumor cells (dark purple circles), and 30% of stromal cells (light pink circles). B. The stabilized oxygen distribution color-coded using the EPR imaging color scheme, with high oxygen levels (yellow) near the vessels and low oxygen levels (cyan) in poorly vascularized regions. C. Changes in the average oxygen concentration over time from initial 0 mmHg to the stable level of 29.89 mmHg.

