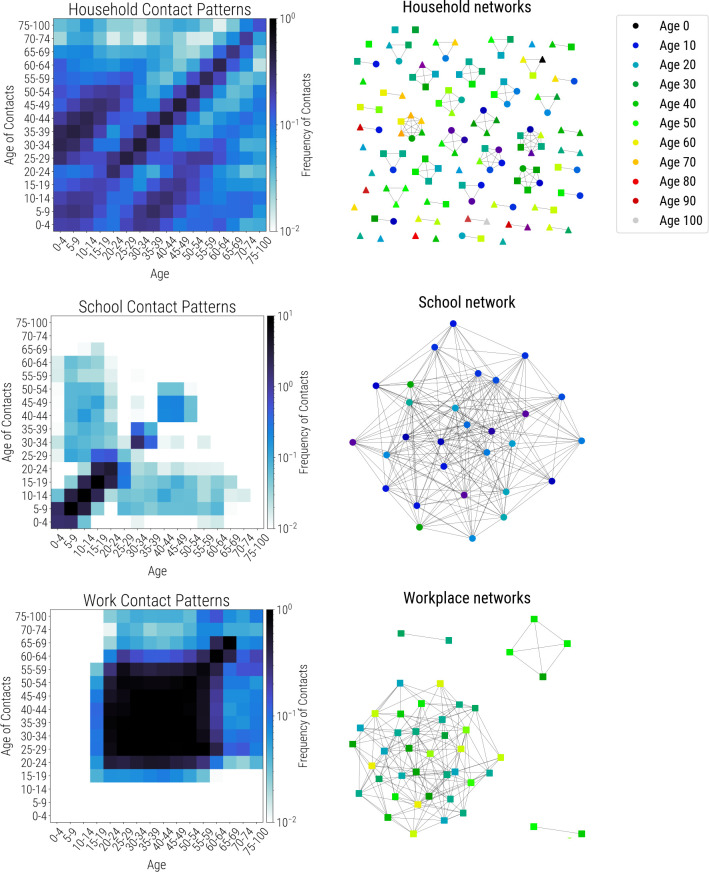
Fig 4.
Synthetic population networks for households (top), schools (middle), and workplaces (bottom). Age-specific contact matrices are shown on the left, while actual connectivity patterns for a 127-person subsample of a population of 10,000 individuals are shown on the right. All individuals are present in the household network, including some with no household connections. A subset of these individuals, including teachers, are present in the school network (circles); another subset is present in workplace networks (squares); some individuals are in neither school nor work networks (triangles).

