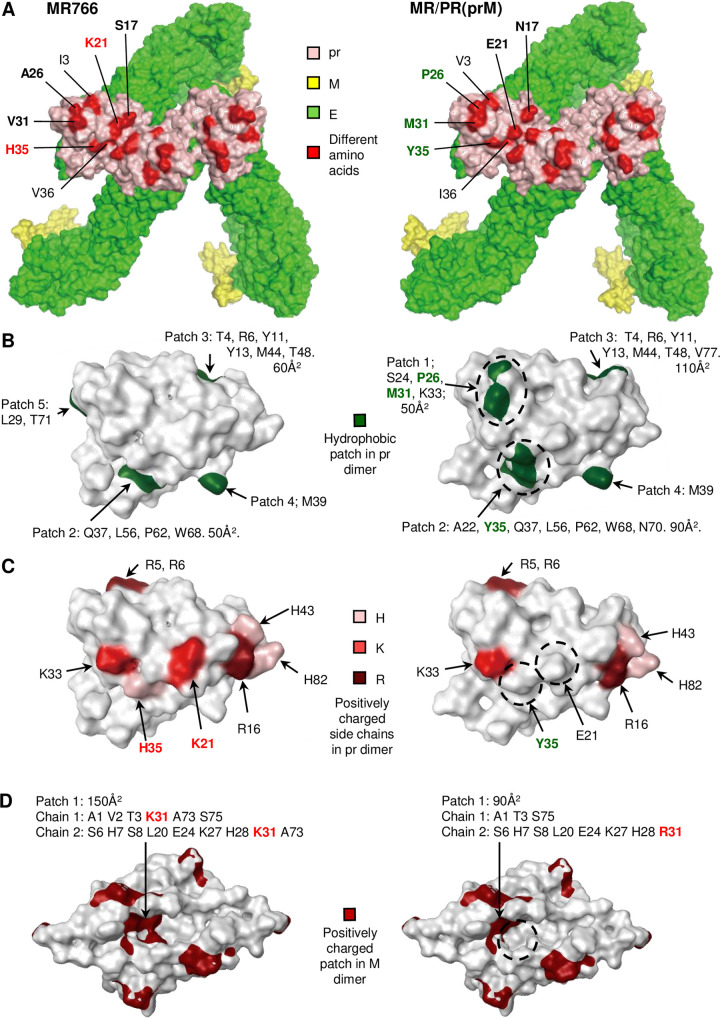
Fig 7. Surface hydrophobicity and positively charge on the prM proteins of MR766 and MR/PR(prM).
(A) Molecular model showing the top surface of the prME trimer in the immature virus. The homology models based on the pr structure (PDB accession code: 5U4W) was generated by MOE homology modeler. The pr, M and E proteins are shown in light pink, yellow and green, respectively. Different amino acids in the pr protein between MR766 and MR/PR(prM) are colored red on the trimetric molecular structure. Amino acids (in text) are indicated for one of the pr proteins in the trimer. Bold text indicates amino acids that have side chains exposed on the surface (position 17, 21, 26, 31 and 35; see S2 Table), with font color corresponding to the amino acids highlighted in (B) and (C) (green–hydrophobic patch, red–positively charged). (B) Patch analysis shows that the pr protein of PRVABC59 has an additional hydrophobic patch due to the A26P and V31M substitutions (Patch 1, 50Å2) and an enlarged hydrophobic patch (50 to 90Å2) due to the H35Y substitution (Patch 2) (dashed circles). The total increase in hydrophobic surface area was 90Å2. A further increase is evident for Patch 3 (60 to 110Å2), although this patch sits on the side of the trimeric spike. The threshold of the patch area was 50Å2. (C) Analyses of positively charged residues on the surface of the pr protein show that the K21E and H35Y substitutions in MR/PR(prM) result in the loss of two positively charged residues exposed (see S2 Table) on the surface of the pr protein (dashed circles). Light pink–histidine (H). Red–Lysine (K). Dark red–Arginine (R). (D) Surface positively charged patches on the M dimer. The patch analysis shows the M protein of MR/PR(prM) (or PRVABC59) decreased a positively charged patch due to the K31R substitution (150 to 90Å2) (dashed circles). The M structure of MR766 was homology-modelled based on the structure (PDB accession code: 5IZ7). Top view of M dimer relative to the viral surface is shown. The threshold of the patch area was 50Å2. The default MOE settings were used for protein surface patch analysis.

