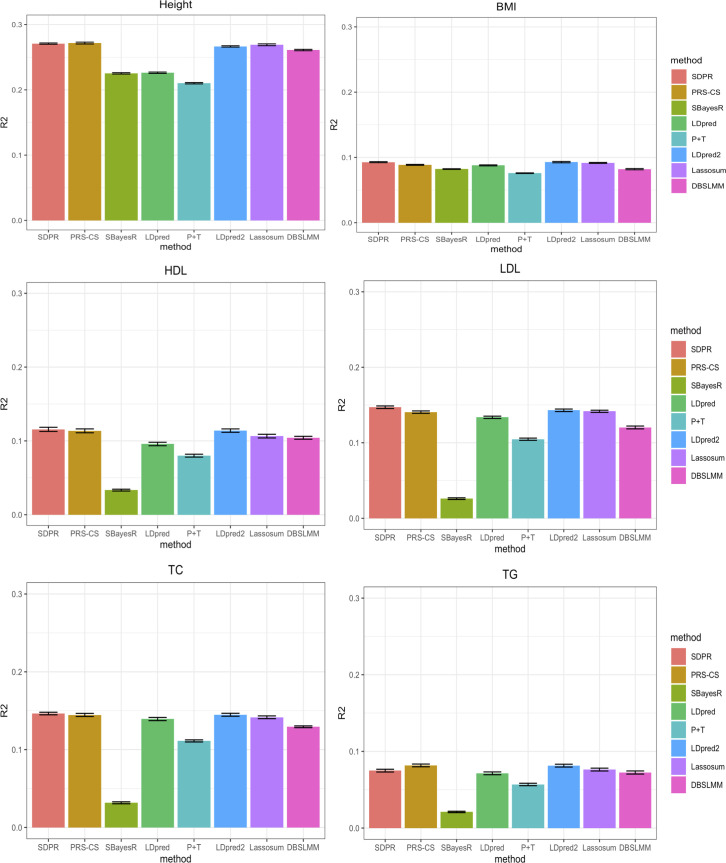
Fig 2. Prediction performance of different methods for six quantitative traits in the UK Biobank.
Selected participants with corresponding phenotypes were randomly assigned to form validation and test dataset, each composing half of individuals. For PRS-CS, LDpred, P+T, LDpred2, lassosum, and DBSLMM, parameters were tuned based on the performance on the validation dataset. We repeated the split and tuning process 10 times. The mean of variance of phenotypes explained by PRS across 10 random splits was reported in the Table G in S1 Text.

