. 2021 Mar 8;2(3):863–875. doi: 10.1039/d0cb00124d

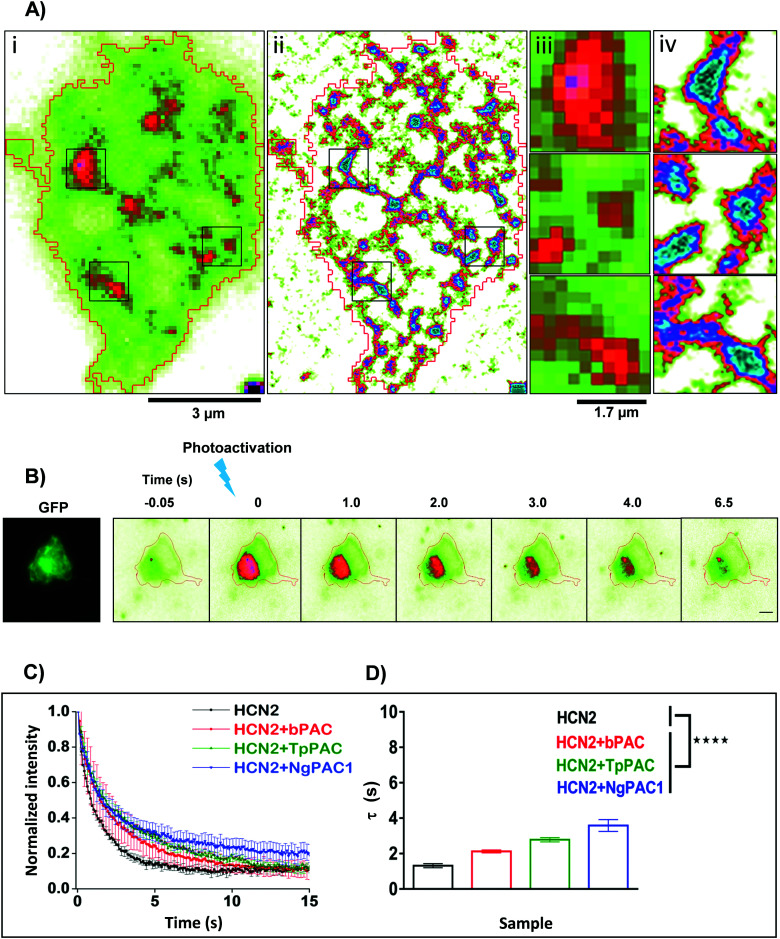
Fig. 2. Targeted control of HCN2 dynamics upon optogenetic modulation of cAMP levels. (A) Wide field (i) and SRRF (ii) images of Neuro-2a cells expressing mEos::HCN2. To achieve high spatial resolution, wide field images were processed using SRRF (ESI). Scale bar: 3 μm. Zoomed diffraction limited (iii) and SRRF (iv) images of selected regions outlined in black. Scale bar: 1.7 μm. (B) Neuro-2a cells expressing mEos::HCN2 + PAC imaged in the GFP channel (left panel). Representative temporal changes in fluorescence intensity within the photoactivated region upon activation of PAC and photoconversion of mEos molecules with 405 nm are depicted (right series). Scale bar: 10 μm. (C) Fluorescence decay curves representative of the temporal changes in fluorescence intensity upon photoactivation of PAC and photoconversion of mEos molecules are shown. (D) Comparison of fluorescence decay of mEos::HCN2 fit by a single exponential decay model under control condition and upon optogenetically increasing the cAMP level using PAC variants namely, bPAC, TpPAC and NgPAC1. τ represents the decay time constant (n = 11, mean ± s.e.m. from 3 biological replicates, ****p < 0.0001, Mann–Whitney test). The mobility of mEos::HCN2 decreased significantly upon elevating the intracellular cAMP by targeted photoactivation of PACs. The PAC variants modulated the mobility of HCN2, correlated with their photodynamics and amplitude of the light-gated cAMP level altered by the respective PAC.

Fig. 2