. 2021 Mar 8;2(3):863–875. doi: 10.1039/d0cb00124d

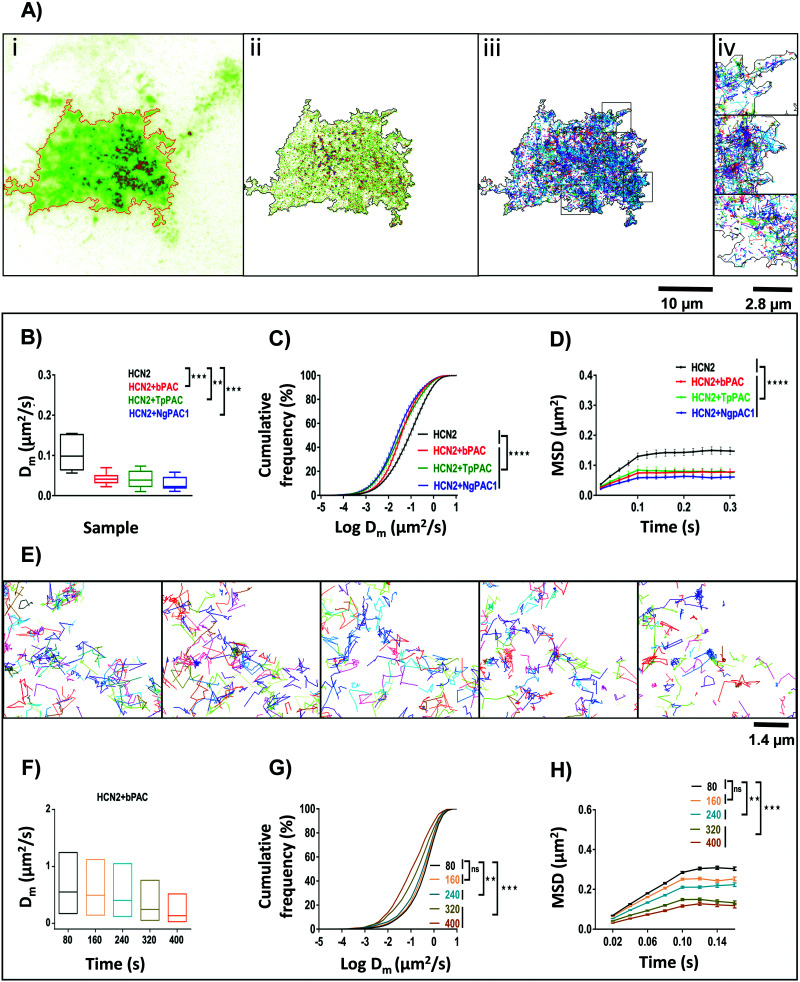
Fig. 3. Global spatio-temporal control of HCN2 mobility by modulating cAMP levels in live cells. (A) TIRF image (i), corresponding super-resolution intensity image (ii) and single particle trajectory map (iii) of Neuro-2a cells expressing mEos::HCN2 and bPAC. Super-resolution intensity image was procured from 20 000 images of single molecules from the photo-converted mEos red state. Single particle trajectory map displaying the individual trajectories of photo converted mEos::HCN2 molecules and thereby their mobility in Neuro-2a cells. Scale bar: 10 μm. Enlarged trajectory map corresponding to the boxed regions (iv). Scale bar: 2.8 μm. (B) Diffusion coefficient Dm of mEos::HCN2 under control conditions and upon elevation of cAMP level by activation of PAC variants namely, bPAC, TpPAC, and NgPAC1. Prior to PALM imaging, acute photoactivation of PACs was done using 488 nm (median, **p < 0.01, ***p < 0.001, Mann–Whitney test). (C) Effect of increase in cAMP level on the cumulative distribution of instantaneous diffusion coefficient of mEos::HCN2 compared to control conditions (n = 10, mean ± s.e.m from 2 biological replicates, ****p < 0.0001, 2-way Anova). (D) Mean square displacement (MSD) plots of mEos::HCN2 single molecule trajectories under control conditions and upon optogenetically increasing the cAMP level by photoactivation of different PACs (bPAC, TpPAC and NgPAC1). Error bars indicate cell to cell variability (n = 10, mean ± s.e.m from 2 biological replicates, ****p < 0.0001, 2-way Anova). (E) Temporal changes in the single molecule trajectories of mEos::HCN2 molecules with increase in cAMP level by chronic photoactivation of bPAC and simultaneous photoconversion of mEos with 405 nm. Representative data set from a single cell showing single particle trajectories of mEos::HCN2 between the indicated time points namely, 80, 160, 240, 320 and 400 s are displayed from left to right. With continuous increase in cAMP level, the diffusion of HCN2 molecules is decreased. (F) Temporal change in the diffusion coefficient (Dm) of mEos::HCN2 with simultaneous light regulated elevation in the cAMP level via photoactivation of bPAC (computed from E). (G) Cumulative distribution of instantaneous diffusion coefficient of mEos::HCN2 trajectories with a temporal increase in cAMP level for five subsequent time windows (computed from E, **p < 0.01, ***p < 0.001, 2-way Anova). (H) Time dependent decrease in MSD with temporal increase in cAMP level (computed from E, mean ± s.e.m of trajectories/time window frame, **p < 0.01, ***p < 0.001, 2-way Anova). Alteration in cellular cAMP levels by acute photoactivation of PACs by saturation stimulation or by chronic optical stimulation regulated the mobility of cAMP effector HCN2 channels in a spatio-temporal manner.

Fig. 3