. 2021 Mar 8;2(3):863–875. doi: 10.1039/d0cb00124d

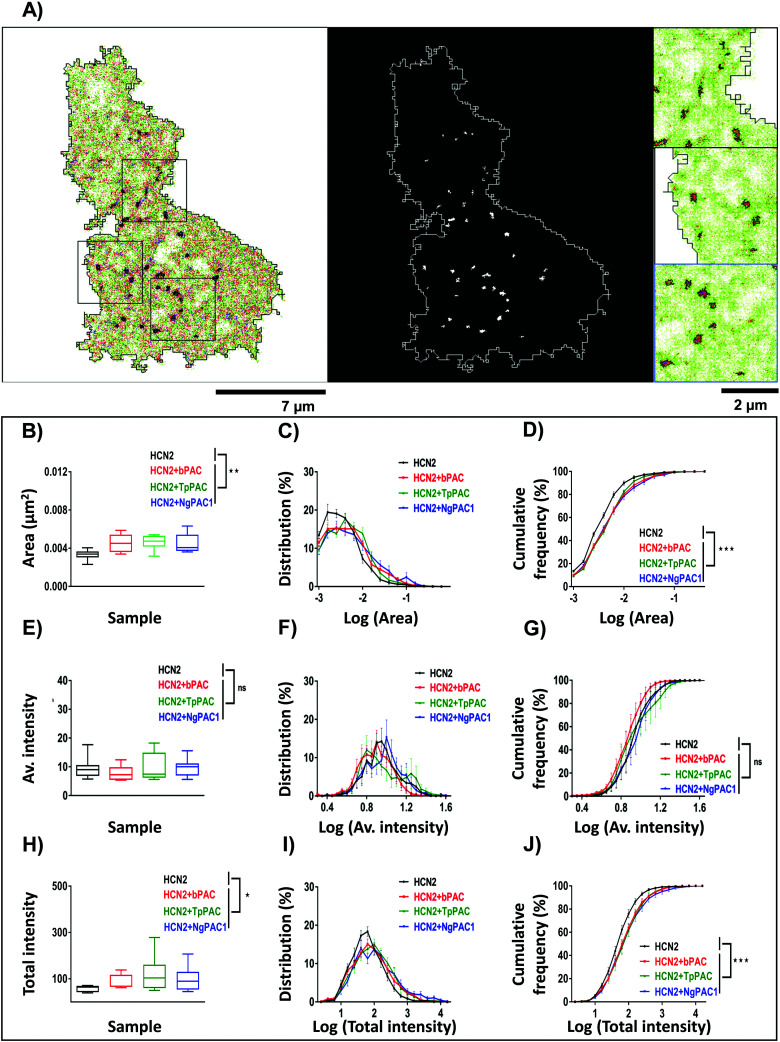
Fig. 4. Modulation of nanoscale aggregation of HCN2 clusters upon light regulated elevation of cAMP. (A) Super-resolution intensity image (left panel) and segmented intensity map (middle panel) representing the clusters of mEos::HCN2 (outlined in black in the left panel, and white in the middle panel). Scale bar: 7 μm. Zoomed regions (right panel) from a representative cell marked by black boxes in the intensity image. Scale bar: 2 μm. (B, E, and H) Quantification of the area, average and total intensity of HCN2 clusters upon elevating the cAMP level compared to the control condition, respectively (n = 9, median, *p < 0.05, **p < 0.01, Mann–Whitney test). (C, F, and I) Probability distribution of area, average and total intensity of HCN2 clusters for the control and elevated cAMP condition, respectively. (D, G, and J) Cumulative frequency distribution plotted for the area, average and total intensity of HCN2 clusters for the control and upon increasing the cAMP level, respectively (n = 9, mean ± s.e.m from 2 biological replicates, ***p < 0.001, 2-way Anova). A significant increase in the cluster area, number and total intensity of mEos::HCN2 nanodomains was observed upon cAMP induction by PAC variants, compared to the control, in contrast to the average intensity of domains which remained unaltered.

Fig. 4