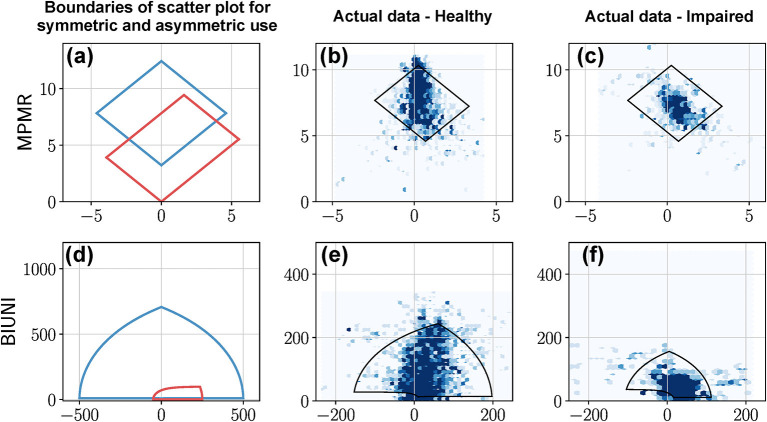
Figure A 2.
MPMR, and BIUNI plots of actual data from a healthy and impaired participant. The first column shows (a,d) examples of the boundary of the distribution of scatter plots for the MPMR and BIUNI plots for symmetric and asymmetric upper-limb use. This closed curve corresponds to the L1 and L2 curves for different values of and . (b,c) Depict the MPMR scatter plots for a healthy and impaired participant using data collected during a single day. (e,f) Corresponding BIUNI plots for the same subjects. The closed black curves shown in the plots for the healthy and impaired participant correspond to the 2.5th and 97.5th percentiles for and .

