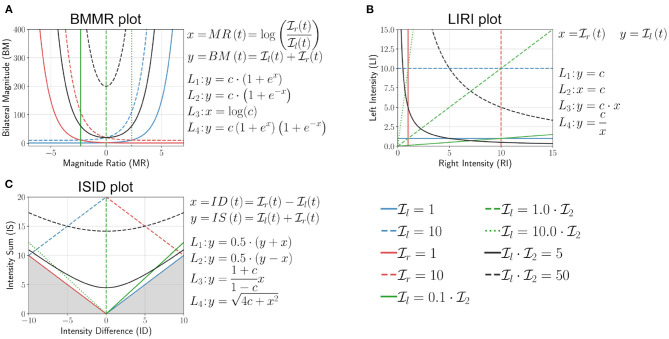
Figure 6.
Analysis of (A) bilateral magnitude vs. magnitude ratio (BMMR) plot (Bailey et al., 2014), (B) left intensity vs. right intensity (LIRI) plot (David et al., 2020), and (C) intensity sum vs. intensity difference plot (ISID), by investigating the nature of the family of four curves L1 (blue), L2 (red), L3 (green), and L4 (black) introduced in Equation (11). The solid and dashed lines indicate different values of c for the same curve.

