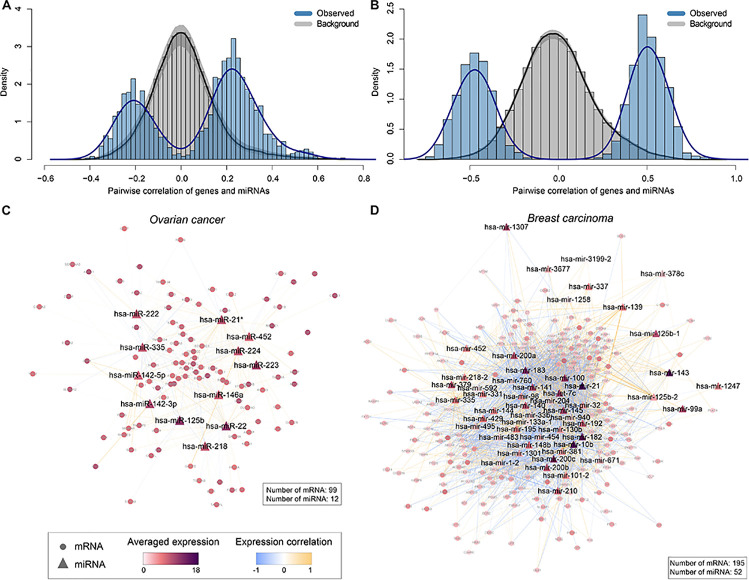
FIGURE 5.
Interpretations of the canonical variate pairs. (A,B) The distributions of observed pairwise correlation coefficients between non-zero mRNA variables and miRNA variables in the first canonical variates, compared to the corresponding background distributions in this panel (A) ovarian cancer and (B) breast carcinoma (BRCA), respectively. The gray area represents 95% confidence intervals. (C,D) MiRNA-mRNA regulatory networks constructed based on non-zero mRNA and miRNA variables selected by sparse CCA in this panel (C) ovarian cancer and (D) breast carcinoma, respectively. Triangles and circles represent miRNAs and mRNAs, respectively. Edges represent the interactions between miRNAs and mRNAs experimentally validated and/or predicted by databases including miRecords, miRTarBase, TarBase, TargetScan, PITA, and miRanda. Nodes are colored in proportion to the averaged log2 transformed expression levels of mRNAs/miRNAs across all TCGA samples, and edges are colored based on Pearson correlation coefficients between the expression levels of miRNAs and mRNAs.

