. 2021 Jan 5;2(2):636–644. doi: 10.1039/d0cb00191k

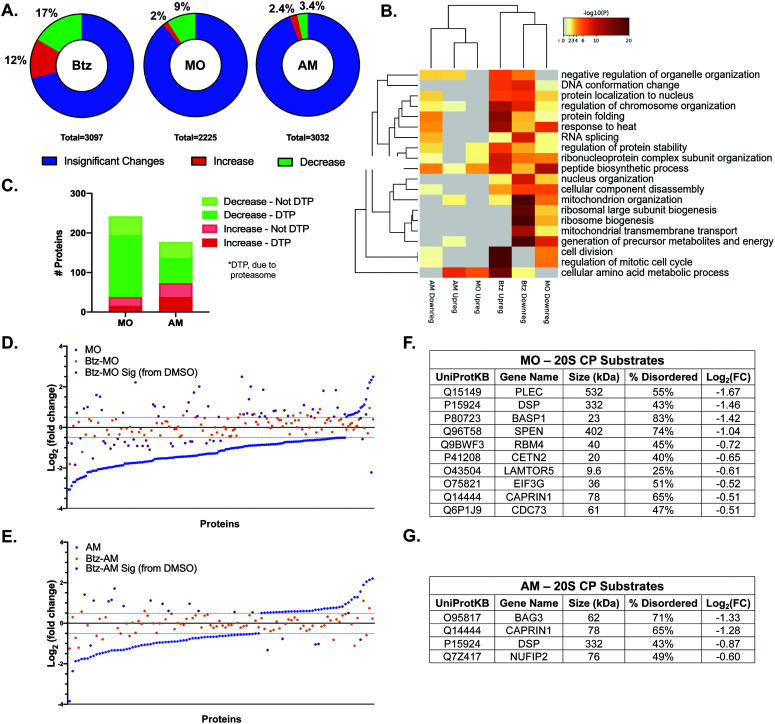
Fig. 5. (A) Percent of protein levels that increased or decreased in the Btz (left), MO (middle), or AM (right) treated samples compared to a DMSO treated control. (B) Gene ontology analysis of the proteins shown to be upregulated or downregulated in each of the treatments shown in (A). (C) We compared the changes in protein levels due to MO/AM treatment with the changes in the same protein levels in the Btz-MO/AM treated samples to determine which protein level changes were due to proteasome activity. The log2(fold change) of proteins that significantly changed and were shown to be regulated by proteasome activity in the MO (D) and AM (E) treated samples. Each dot represents a particular protein and the impact of MO/AM (blue) or Btz-MO/AM dual treatment (orange) on the protein levels compared to DMSO. The purple dots represent proteins in the Btz-MO/AM samples that were significantly changed (log2(FC) > 0.5; p < 0.05) compared to DMSO. Known 20S CP substrates in the MO (F) or AM (G) treated samples shown to decrease due to proteasome activity.

Fig. 5