. 2020 Jul 16;1(3):137–147. doi: 10.1039/d0cb00060d

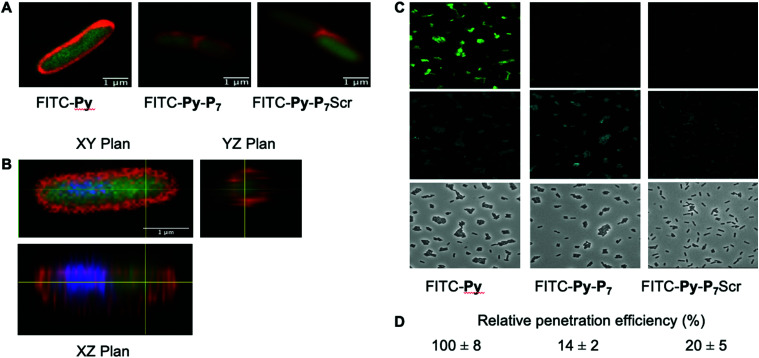
Fig. 2. Analysis of peptide penetration into E. coli cells. (A) Confocal LSM of D22 E. coli cells exposed to the three different FITC labeled peptides (9 μM) and stained with Nile Red. Composite image were obtained by merging the FITC and Nile Red channels and clearly show the cytoplasmic localization of FITC. (B) Three-dimensional analysis of the FITC-Py (9 μM) peptide penetration in the bacterial cytoplasm. D22 cells were treated as in (A), except that they were additionally stained with DAPI (blue). It clearly appears that the two fluorescent signals from DAPI (blue) and FITC (green) are located within the cell, while Nile Red stains the lipidic phases of membranes. This unambiguously indicates the cytosolic localization of the peptide. (C) Representative fluorescent microscopy images of D22 E. coli cells exposed to the three different FITC labeled peptides (9 μM) and stained with DAPI. The uptake of the bifunctional peptides is clearly less efficient than the one of FITC-Py. (D) Relative FITC fluorescence quantification (average ± SD) normalized to that measured with FITC-Py peptide. Methods and quantification protocol are detailed in the Experimental section.

Fig. 2