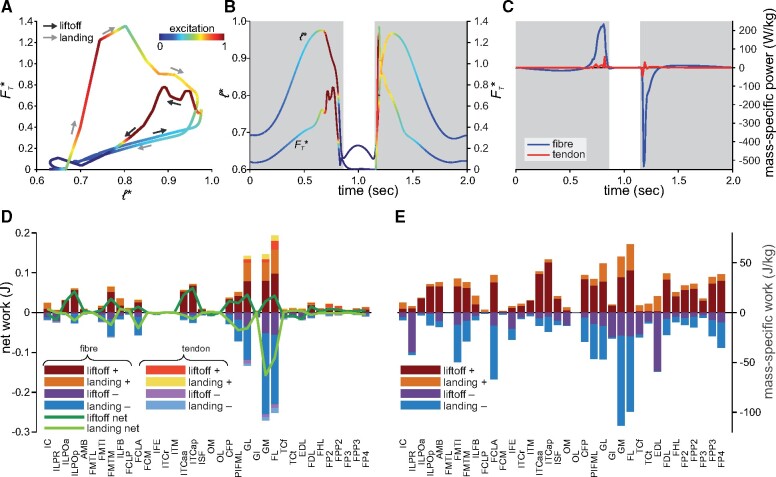
Fig. 4.
Energetic aspects of MTU behavior in the nominal simulation. (A) Exemplar work loop, plotted for the GM, comparing normalized tendon force (FT* = tendon force divided by Fmax) and normalized fiber length. (B) Time histories of normalized tendon force, normalized fiber length, and excitation for the GM. (C) Time histories of muscle mass-specific fiber and tendon power, summed across the extensor muscles analyzed previously for guineafowl by Henry et al. (2005). (D) Net positive and negative work for fibers and tendons in each MTU, partitioned between liftoff and landing phases; also plotted is the net fiber work during liftoff and landing. (D) Mass-specific fiber work in each MTU, partitioned between liftoff and landing phases. See Supplementary Table S1 for abbreviations.

