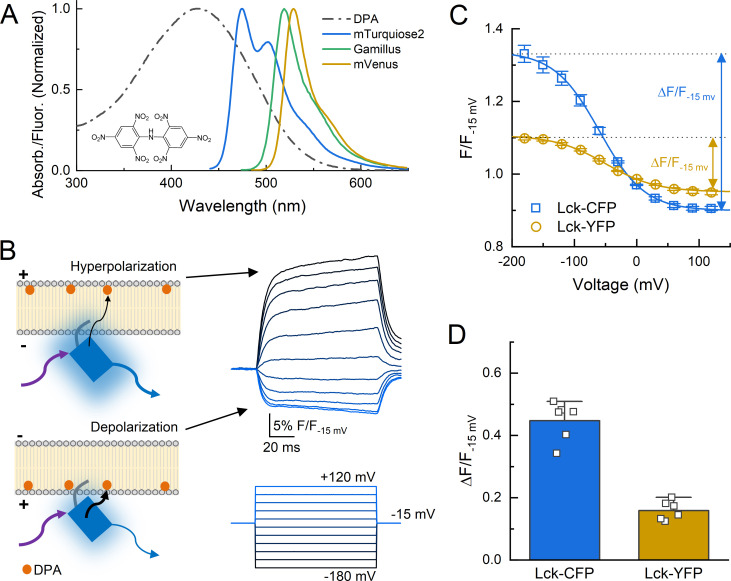
Figure 1. Schematic of dipicrylamine (DPA) quenching measurements.
(A) Absorption (dotted line) or fluorescence emission (solid lines) spectra of DPA (black), CFP variant mTurqoise2 (blue), GFP variant Gamillus (green) and YFP variant mVenus (yellow). Structure of DPA inset. (B, left) DPA (orange circle) localizes to the outer leaflet with hyperpolarization and moves to inner leaflet upon depolarization, resulting in stronger quenching. Arrows reflect excitation (purple), emission (blue), or resonance transfer (black). (B, right) Exemplar patch fluorometry data of Lck-CFP fluorescence changing during voltage steps. (C) Single cell fluorescence, normalized to fluorescence at −15 mV, over a range of voltages for Lck-CFP (blue) and Lck-YFP (yellow). Solid lines are fits to Boltzmann function which yield ΔF/F. (D) Summary of ΔF/Fs from Lck-CFP or Lck-YFP. Squares are single cells (N = 6 cells per construct) and error bars depict SEM.


