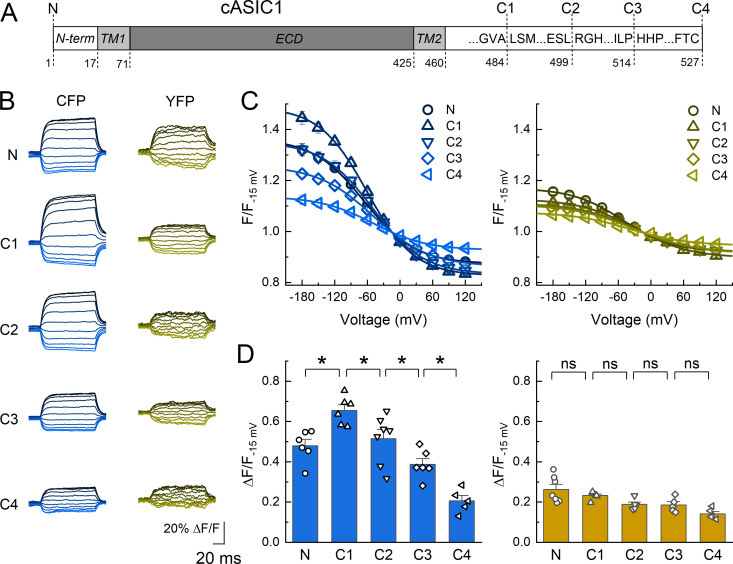
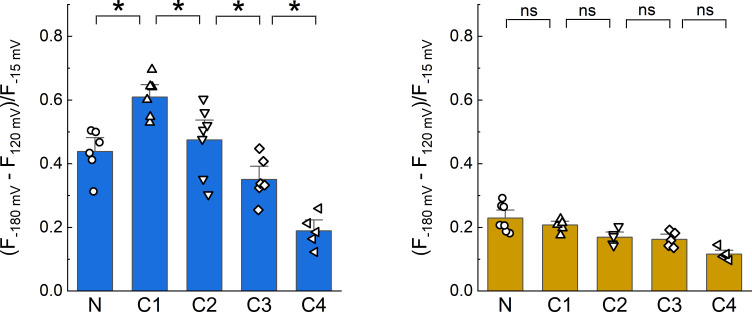
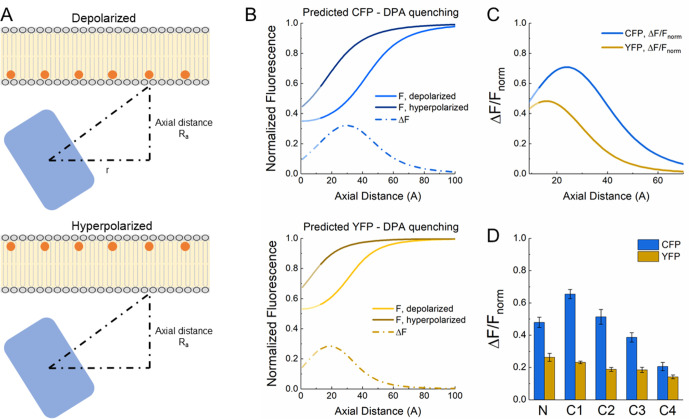
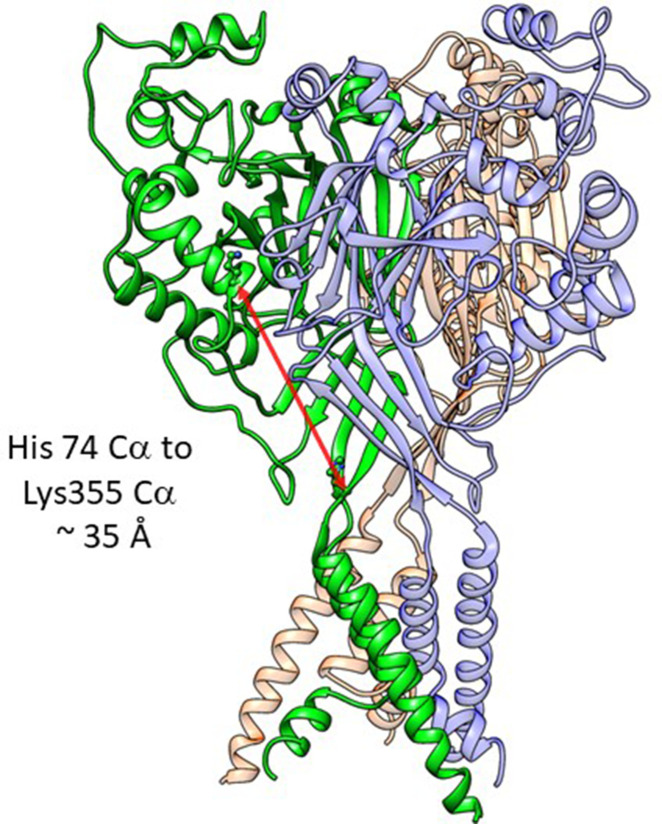
Figure 2. Dipicrylamine (DPA) quenching of CFP or YFP insertions in cASIC1 intracellular domains.
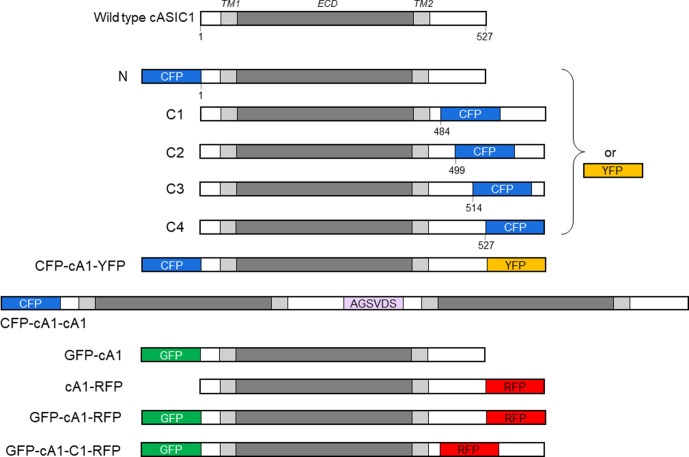
(A) Schematic of cASIC1 constructs used. The extracellular domain (ECD) and transmembrane helices (TM) are gray with amino and carboxy termini depicted in white. Letters within the carboxy tail indicate the amino acid sequence around the insertion site while the lower numbers give the position. (B) Example fluorescence traces for each of the CFP or YFP insertions. Voltage protocol and coloring is the same as in Figure 1B. (C and D) Quenching curves and summary plots for CFP (left) and YFP (right) insertions. Symbols denote individual cells (N = 5–7 cells) and error bars represent SEM. Asterisks mark significant differences with p values of 0.004 (N–C1), 0.0475 (C1–C2), 0.0483 (C2–C3), and 0.0163 (C3–C4) for CFP.

