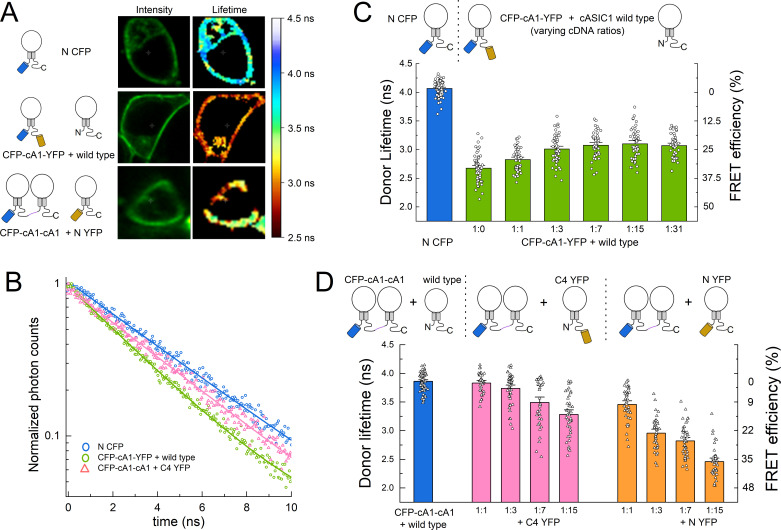
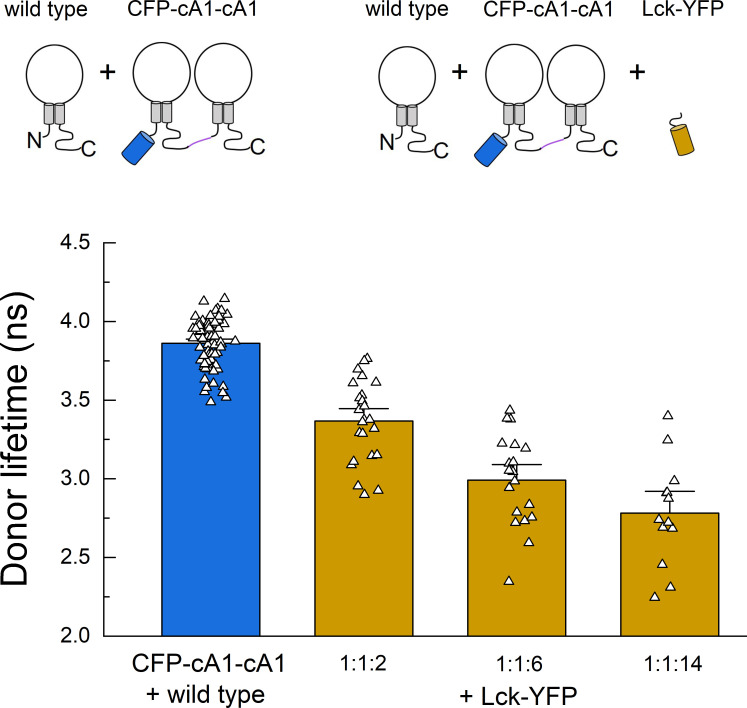
Figure 3. Fluorescence resonance energy transfer (FRET) is stronger within subunits than between subunits.
(A) Example cells transfected with the indicated constructs showing intensity (left) and lifetime (right) images. (B) Time-correlated single photon counting (TCSPC) histograms from the plasma membrane of cells in A and additional control. Solid line is a single exponential fit to the data. (C) Cartoon (upper) and lifetimes (lower) from the indicated constructs for measuring intra-subunit FRET. (D) Cartoon (upper) and lifetimes (lower) for measuring inter-subunit FRET. Symbols denote single cells (N = 35–76 cells) and error bars are SEM.


