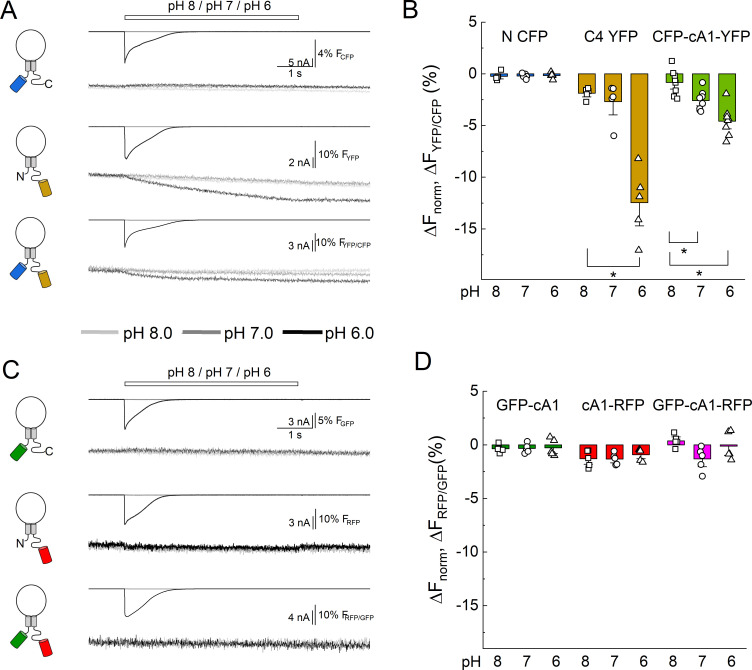
Figure 4. Extracellular acidification produces no change in fluorescence resonance energy transfer (FRET) when using pH-insensitive fluorescent proteins (FPs).
(A) Cartoons (left), electrophysiology (upper), and fluorescence traces (lower) from single cells transfected with the CFP, YFP, or both FPs attached to cASIC1 during pH jumps from eight into pH 8, pH 7, or pH 6. Fluorescence trace is the acceptor fluorescence signal divided by the donor. (B) Summary of change in acceptor/donor ratio during pH changes. (C) Same as in A but for pH-insensitive variants of GFP and RFP (see Materials and methods). (D) Summary of change in acceptor/donor ratio during pH changes. Symbols indicate single cells (N = 5–8 cells), error bars are SEM. Asterisks denote statistical significance with p-values of 0.028 for YFP pH 8 versus 6, 0.031 and 0.0025 for CFP-cA1-YFP pH 8 versus 7 and pH 8 versus 6, respectively.


