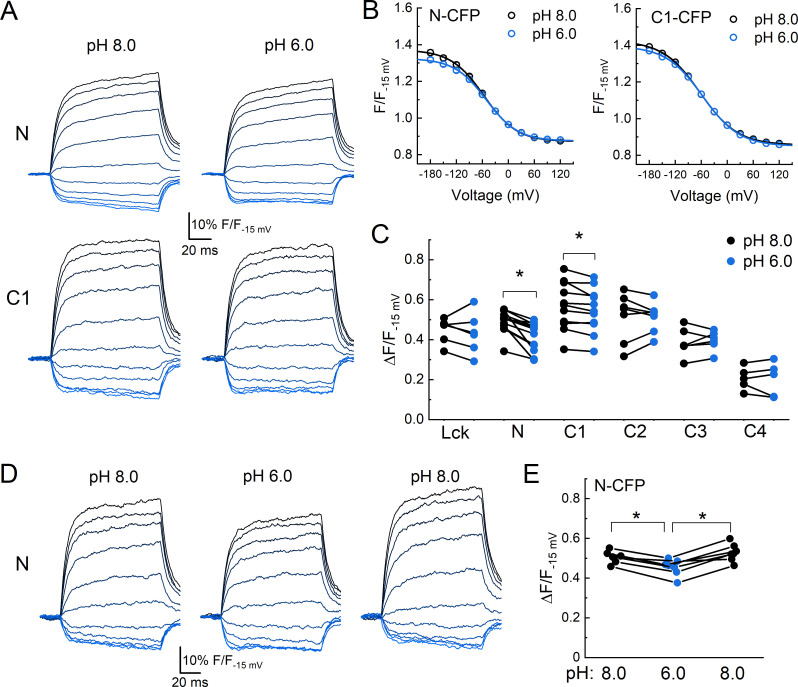
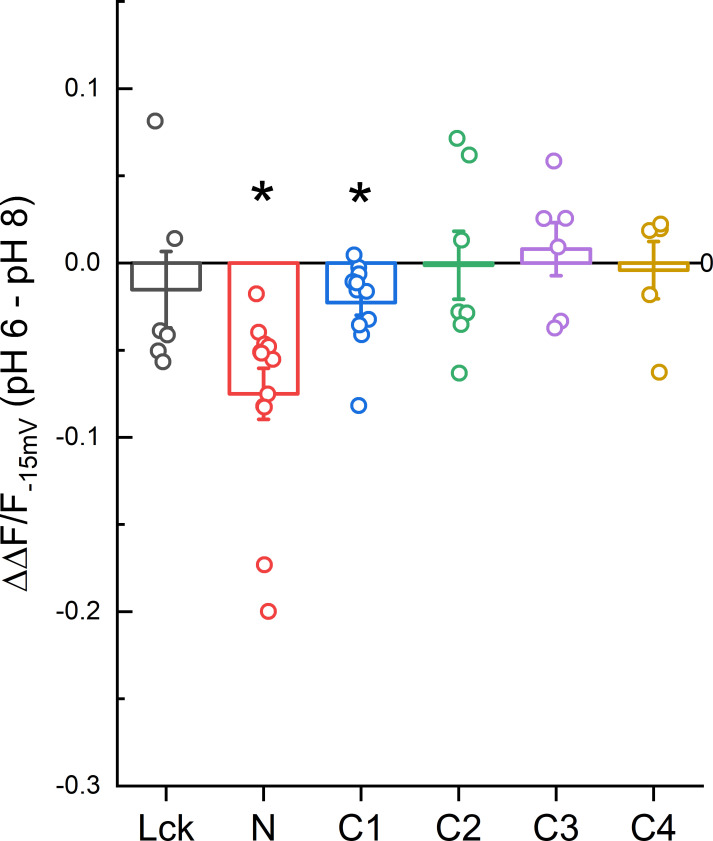
Figure 5. Acidification induces an axial motion of the membrane proximal region.
(A) Example CFP fluorescence quenching traces from single cells expressing N or C1 CFP-cASIC1 with extracellular pH 8 (left) or pH 6 (right). (B) Quenching voltage curves for CFP inserted in N (left) or C1 (right) position. Curves in extracellular pH 8.0 (resting state) shown in black and pH 6.0 (desensitized) in blue. (C) Summary of the extents of quenching at each position with extracellular pH 8 (black) and pH 6 (blue). Symbols denote individual cells (N = 5–13 cells per construct) and error bars represent SEM. Asterisks denote statistical significance by Wilcoxon signed-rank test after correction for multiple comparisons. The p-value for N and C1 are 0.0.0010 and 0.0.033, respectively. (D) Fluorescence-voltage traces from single cell expressing N CFP in the indicated extracellular buffer with 5 µM dipicrylamine (DPA). (E) Summary of the voltage-dependent extent of DPA quenching from N CFP in the indicated extracellular pH. Symbols denote individual cells (N = 7) and error bars represent SEM. * indicates p-value < 0.05 by paired Wilcoxon signed-rank test.


