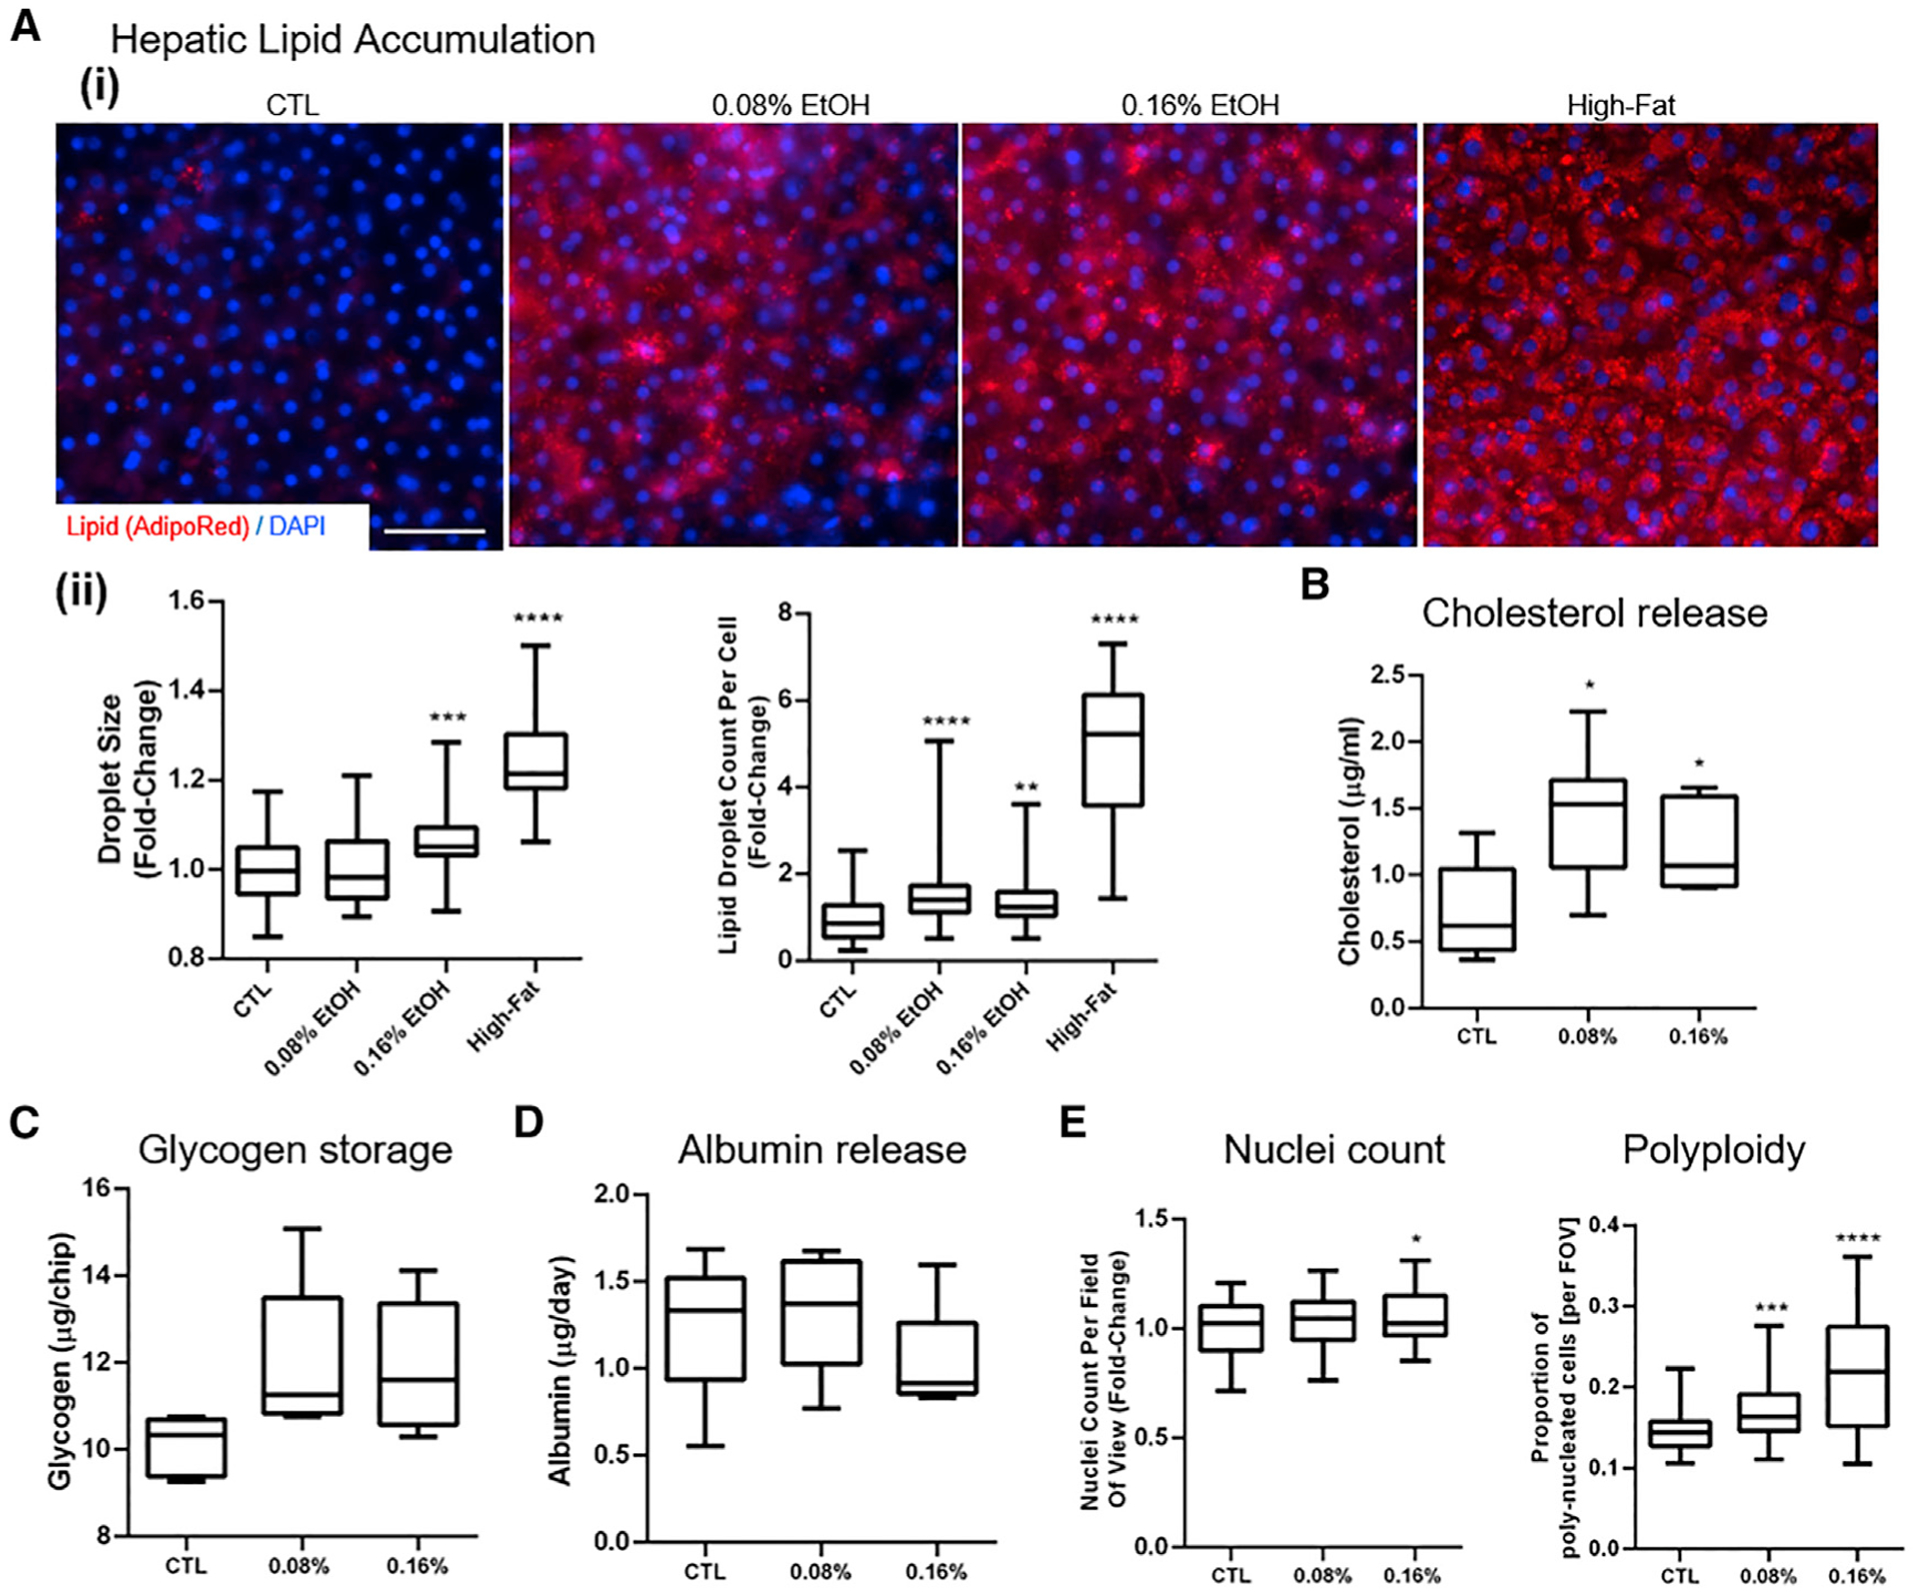
Figure 2. Assessment of liver toxicity, metabolic changes, and polyploidy in the ALD/ASH Liver-Chip.

(A) Hepatic lipid accumulation. (i) Lipid droplet accumulation in hepatocytes visualized using AdipoRed staining after administration of fat (oleic acid 1 μg/mL; positive control) or ethanol (0.08% and 0.16%) for 48 h. Scale bar, 50 μm. (ii) Number of lipid droplets per cell and lipid droplet size (projected area).
(B–D) Quantitative analysis of hepatic functional markers in the Liver-Chip after 48 h of exposure to physiologically relevant BACs. Fluorometric assessment using ELISA of cholesterol levels in the effluent (B), glycogen storage in cell lysate (C), and albumin release (D).
(E) Nuclei count per field of view and proportion of hepatocytes with multiple nuclei per cell (polyploidy). Data represent median ± (minimum and maximum). *p < 0.05; **p < 0.01; ***p < 0.001; ****p < 0.0001 versus control (Kruskal-Wallis and Dunnett’s multiple comparisons test).
