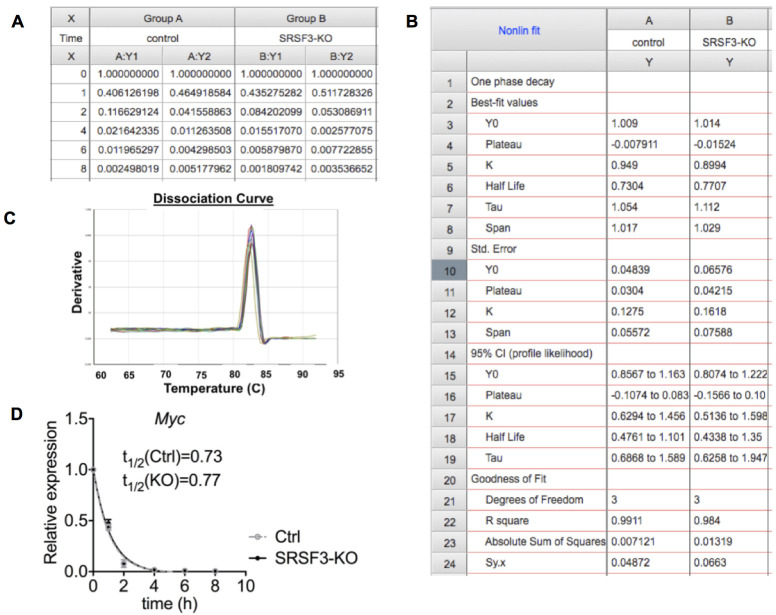
Figure 2. Data analysis.
A. Relative Myc mRNA abundance (2(-CT)) for each time point for 2 replicates in control and SRSF3 depleted iPS cell samples. B. One phase decay analysis in GraphPad Prism. C. The dissociation curve with a single peak indicating the amplification of a single PCR product. D. Graph representing Myc mRNA decay in control and SRSF3-knockout (KO) cells after Actinomycin D treatment demonstrating similar half-lives for Myc mRNA in control and SRSF3-KO cells.

