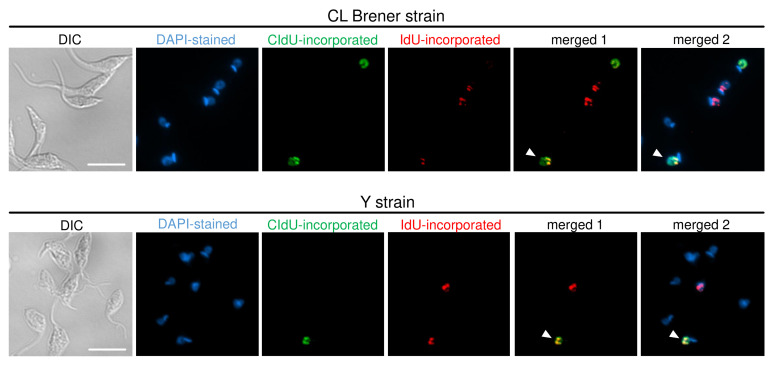
Figure 4. ADExTA applied in CL Brener and Y strains.
Representative images are organized in six columns: DIC (to see morphology of the cells), DAPI (staining organelles containing DNA), CldU-incorporated cells (green), IdU-incorporated cells (red), merged 1 (CldU + IdU overlay), and merged 2 (DAPI + CldU + IdU overlay). The white arrows indicate cells that suffered DNA exchange, i.e., they have a nucleus containing CldU and IdU incorporated. Scale bars = 10 μm.

