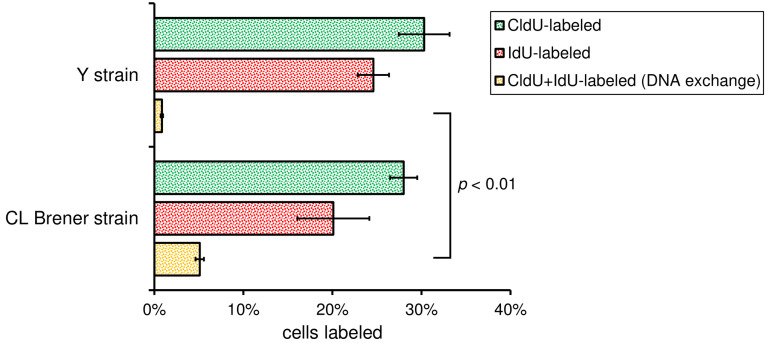
Figure 6. Bar graphs showing the DNA exchange measurement.
Bars represent the percentage of cells CldU-labeled (green), IdU-labeled (red), and CldU + IdU-labeled (yellow), which represents DNA exchange, for the two strains analyzed (Cl Brener and Y). More than 200 cells of each strain were analyzed per biological replicate. Error bars indicate SD of the triplicates. P-value was obtained using Student’s t-test. The numerical analysis presented in this figure was originally published in Alves et al. (2018) .

