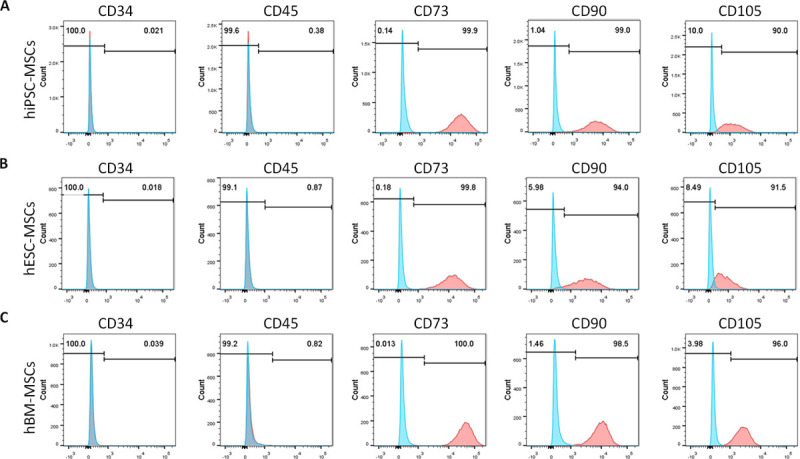
Figure 2. Flow cytometric analysis of MSC surface antigens in hiPSC-ESCs, hESC-MSCs and hBM-MSCs.

Expression percentages of MSC surface antigens were analyzed in hiPSC-MSCs (A), hESC-MSCs (B) and hBM-MSCs (C). Unstained cells were used as the control. Percentage of cells positive for each marker is calculated by normalizing to the unstained cells. Negative markers: CD34–, CD45–; Positive markers: CD73+, CD90+, and CD105+.
