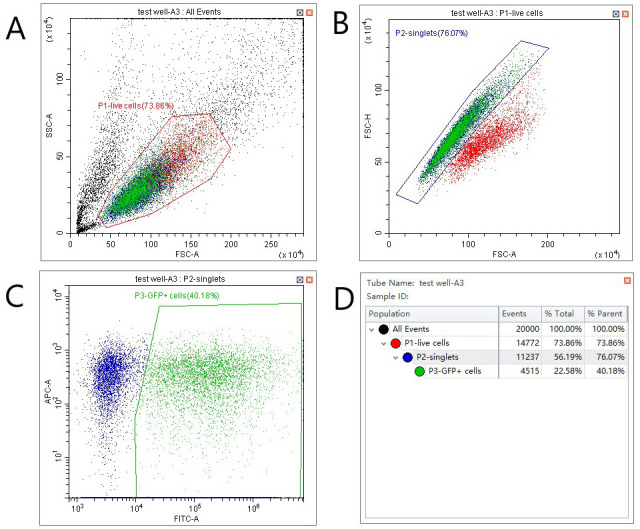
Figure 2. Gating strategy for VDA assays.

A. Select live cells by plotting forward vs. side scatter and setting a gate as shown. B. Distinguish single cells from doublets by plotting forward scatter–area against forward scatter–height. C. Identify GFP positive cells by plotting GFP fluorescence (FITC filter in this case) against an unused and spectrally distinct filter (APC in this case). D. Statistics view to assess transfection efficiency (P3, % parent).
